No one likes missing out, especially at the best time to trade volatility indices.
Based on the information provided above, one can only speculate this question lingers in the heart of every synthetic trader; once and for all, allow me to put an end to this question and provide you with a final researched, unrivaled, and proven answer that cuts across all time frames and will always be time relevant.
One characteristic of the volatility index is consistent liquidity, which is a fault in currency trading. Because of its consistent liquidity across all time frames, it has become one of the most popular synthetic indices traded in Deriv brokers by synthetic indices traders.
- HOW TO TRADE VOLATILITY 75 INDEX
- BEST TIME FOR VOLATILITY INDEX TRADING STRATEGIES
- BEST TIME TO TRADE VOLATILITY INDICES
- BEST TIME TO TRADE VOLATILITY INDEX IN NIGERIA
- VOLATILITY 75 INDEX CHART
- VOLATILITY 100 INDEX STRATEGY
- VOLATILITY 25 INDEX STRATEGY
- BEST INDICATOR FOR VOLATILITY 75 INDEX
- MOST VOLATILE SYNTHETIC INDICES
- MINIMUM LOT SIZE FOR VOLATILITY 75 INDEX
- LOT SIZES FOR SYNTHETIC INDICES
- VOLATILITY 75 INDEX LOT SIZE CALCULATOR
- WHAT TIME DOES VOLATILITY INDEX OPEN?
- WHICH BROKER IS BEST FOR VOLATILITY INDEX?
- HOW DO YOU TRADE A VOLATILITY INDEX?
- WHAT TIME DOES VOLATILITY INDEX OPEN?

HOW TO TRADE VOLATILITY 75 INDEX
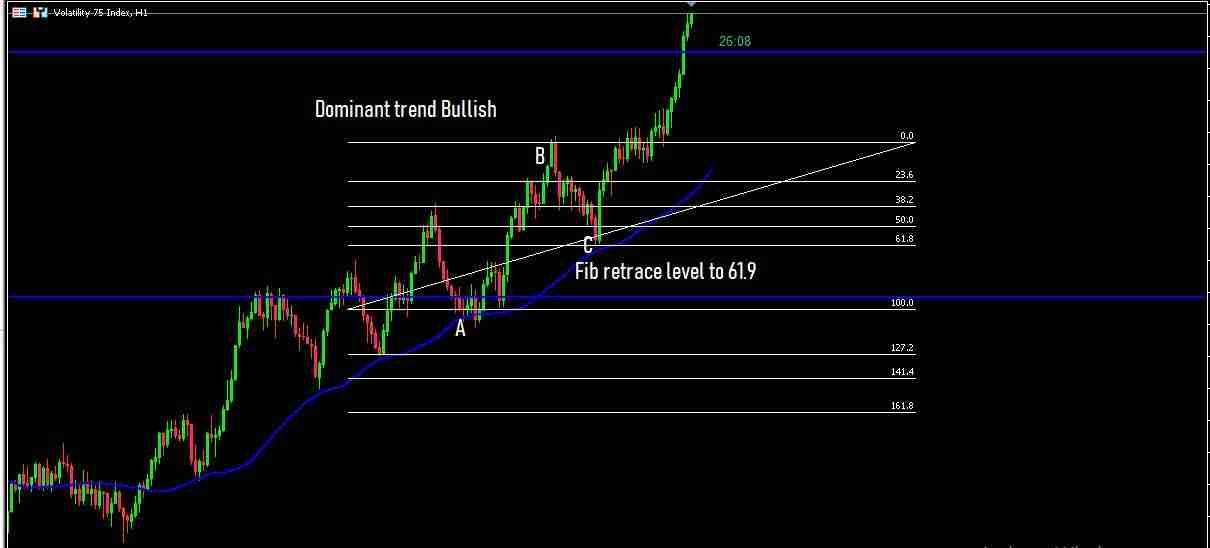
Information is abundant on the internet regarding trading the financial market, as a trader, at the end of the day, what you want is something that works.
This is why I have taken my time to give you free tips on how to trade Volatility 75 index.
Let’s go.
To be successful at trading Volatility 75 index you need to:
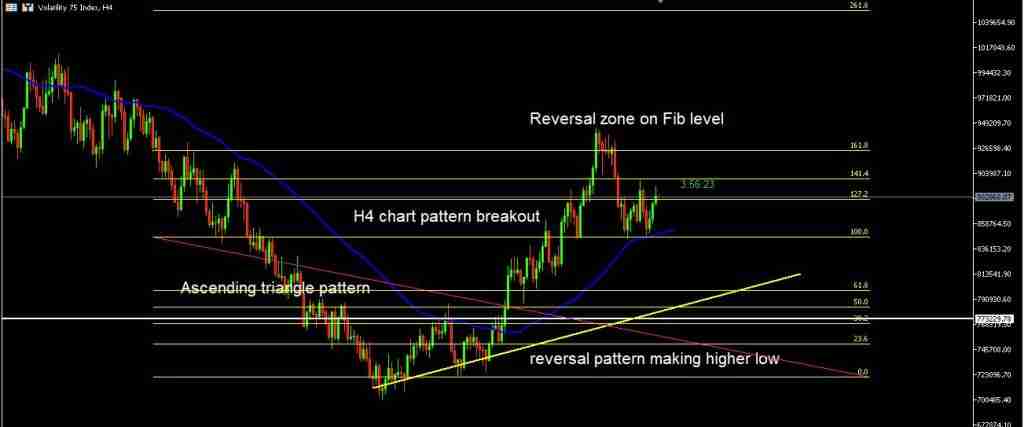
- start paying attention to higher timeframes to identify the dominant trend
- be patient for market retracement using the Fibonacci tool
- retracement to a resistance or support zone
- At the resistance and support zone, wait for a market structure pattern to appear on a lower timeframe for entry.
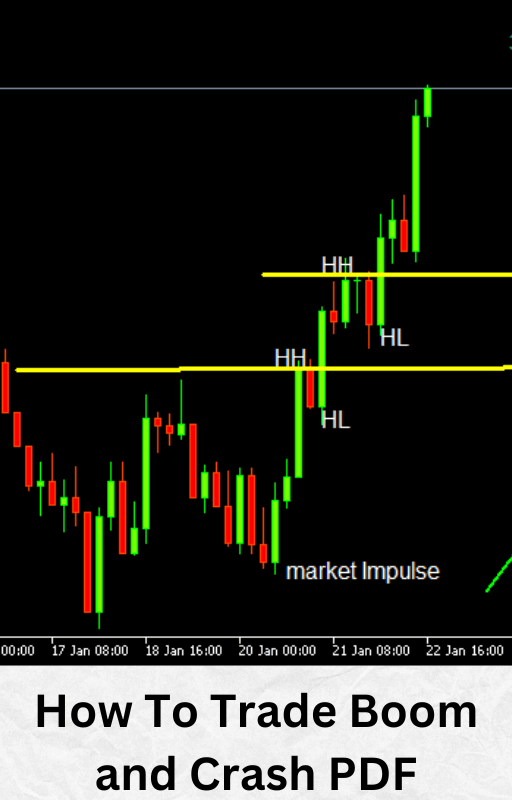
RELATED: STEP INDEX MINIMUM LOT SIZE
BEST TIME FOR VOLATILITY INDEX TRADING STRATEGIES
There are hundreds of volatility index strategies; however, one thing certain is that all of these strategies depend on the market structure as this is the primary design that drives volatility index.
Just to make things clear, every time a trader searches for volatility index on the internet, the user means either volatility VIX or Deriv synthetic Volatility indices. Both respond to market structure.
In this article, our focus will be on Deriv volatility index trading strategies.
If you want a volatility index trading strategy that works, you have to learn to read and identify chart patterns as they give real-time data of the market at the moment compared to moving averages that lag.
Moving is not entirely useless, when used in addition to the real deal (market structure) it gives go-confirmation entries.
To sum this all up, one question you should ask yourself as a synthetic trader is, will you want to have five to ten moving averages and oscillator trading strategies or you would rather have one strategy that fits them all?
This is what trading synthetic is all about, eliminating global events and having constant liquidity which is good for pure technical analysis trading.
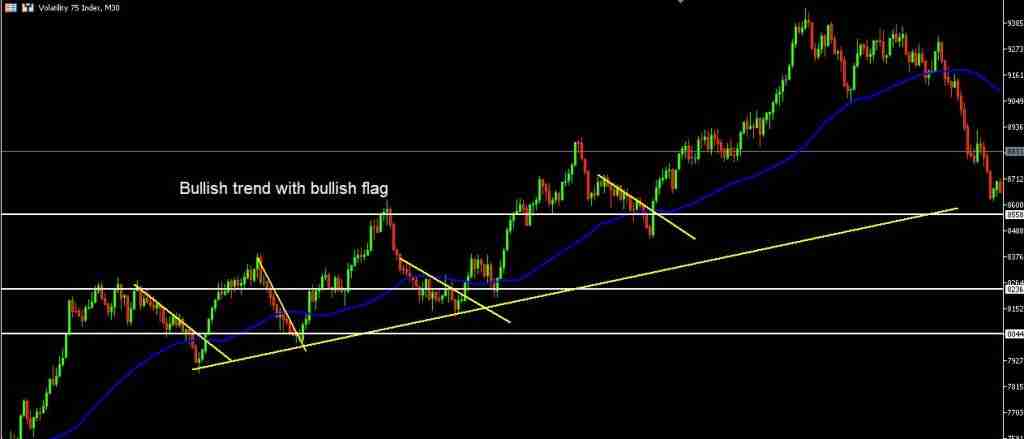
I am going to show you the images below showing volatility index trading strategies across all time frames with a good market set and market structure analysis.
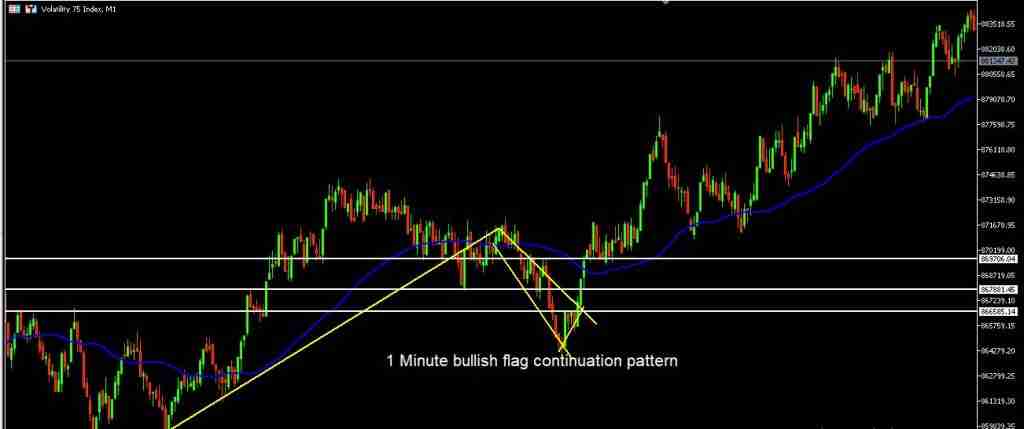
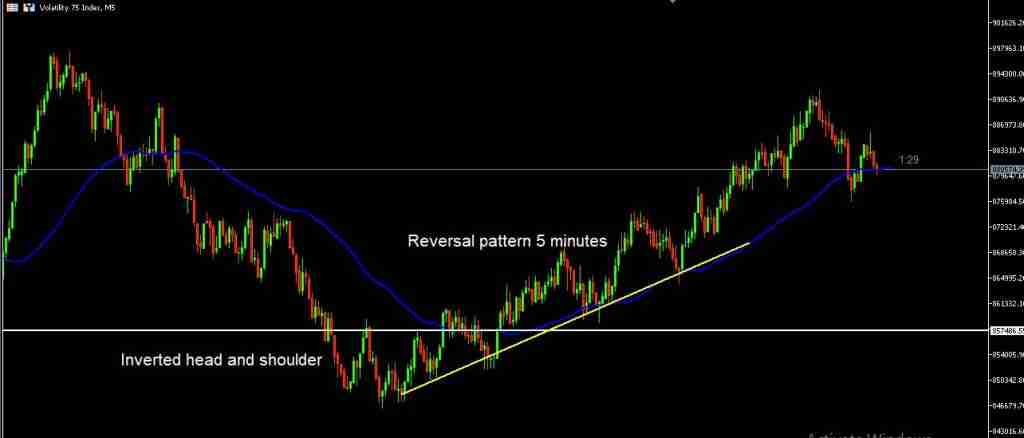
BEST TIME TO TRADE VOLATILITY INDICES
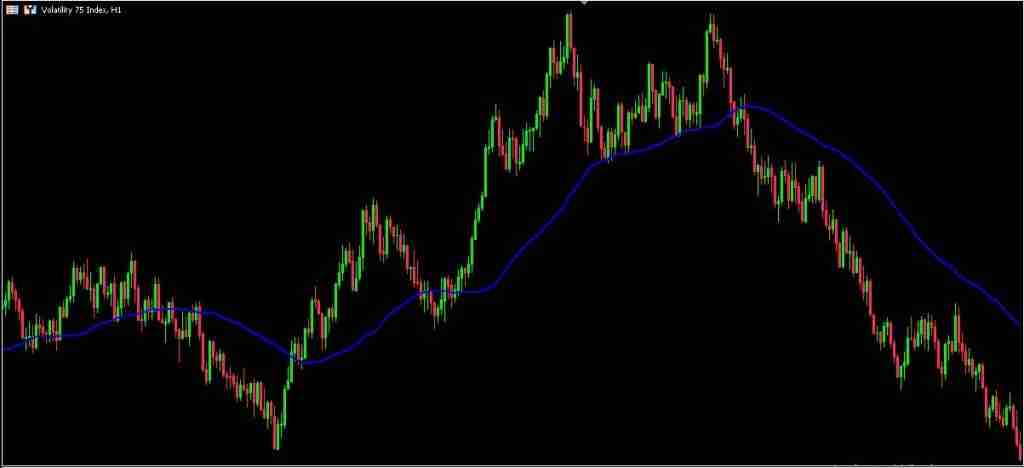
The best time to trade volatility indices is at:
- support and resistance zone on a higher time frame.
- move to a lower time frame and wait for a market structure(chart pattern) that supports the dominant trend.
- take profit at the next support or resistance zone or use a Fibonacci tool to locate possible exit zones.
For more clarity on this, the best time to trade volatility indices is beyond a specific time of day, it is more specific to the market structure and the dominant trend.
These structures are formed across all time frames, as a trader to best see these structures you might have to switch to line chart sometimes.
One of these structures is the M and W patterns. (Reversal patterns).
RELATED: HOW TO TRADE VOLATILITY 75 INDEX ON MT5
BEST TIME TO TRADE VOLATILITY INDEX IN NIGERIA
Unlike forex which is bound to market hours and fundamental news, volatility index is completely the opposite, it is not restricted to market hours, and neither is affected by global events, that being said, the best time to trade volatility index will be when there is a good setup after market analysis.
This setup can be identified across all timeframes because volatility has constant liquidity and volatility, traders can earn profit easily even from timeframes as low as 1 minute.
Another best time to trade volatility index is when there is a clear dominant trend; you follow the trend using a chart pattern line with the bullish or bearish flag to join in the dominant trend.
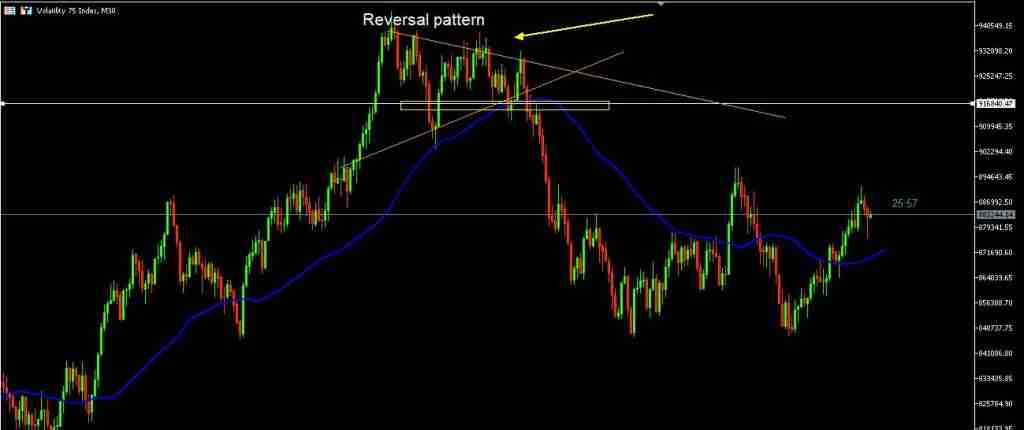
Finally, you can choose to focus on only trading reversal chart patterns like the triple top or triple bottom.
See below volatility 75 setup (Deriv broker).
VOLATILITY 75 INDEX CHART
Volatility 75 index chart can be seen on MT5 trading software, in the chart, you will find all default tools and indicators needed for market analysis.
It comes with twenty timeframes from 1 minute to Monthly for in-depth market analysis, unlike MT4 with lesser time frames.
Volatility 75 is an exclusive synthetic indices of Deriv broker and can only be traded on Deriv. you can also see volatility 75 index chart on Tradingview.
VOLATILITY 100 INDEX STRATEGY
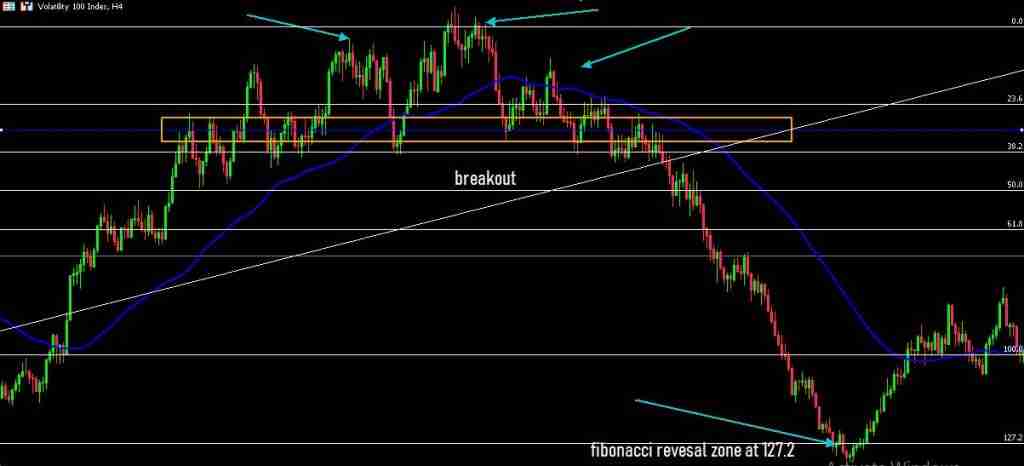
Volatility index 100 is one of the most volatile synthetic indices made by Deriv.
The indices correspond to simulated markets with constant volatility, just like every other indices volatility index 100 responds to the structure of the market across all time frame.
Below is a bearish market structure on volatility 100 index strategy with an exponential moving average of a period: 55, shift: 5.
VOLATILITY 25 INDEX STRATEGY
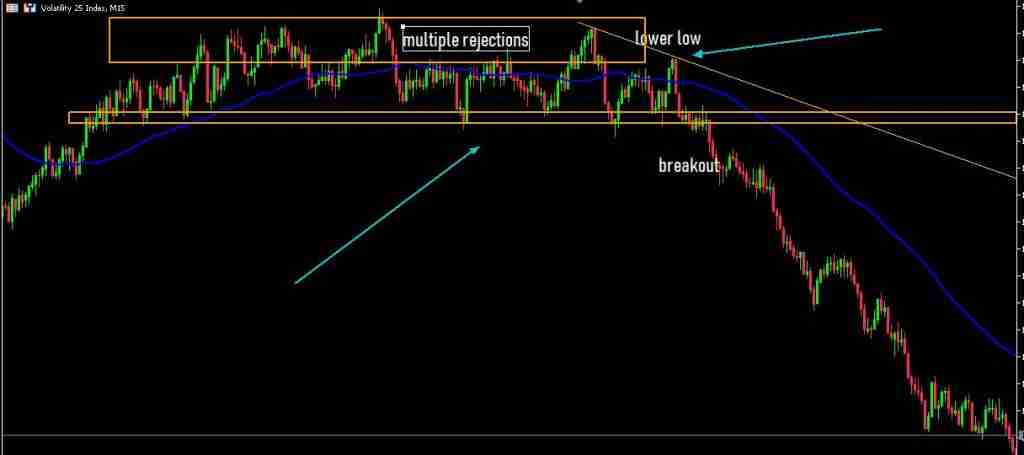
For those conservative synthetic traders out there, volatility 25 index is not as volatile as V75 and V100, the truth of the matter is that no strategy can beat the market structure strategy.
As far as trading is concerned market structure is king as I have mentioned before you will find this structure across all timeframes and trading instruments.
Below is an image of volatility 25 index strategy showing a bearish market structure.
BEST INDICATOR FOR VOLATILITY 75 INDEX
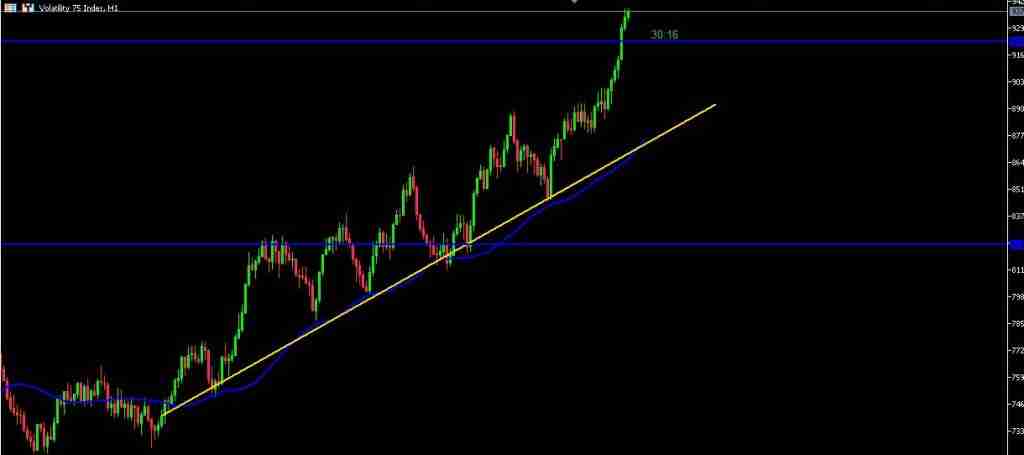
I used to be a synthetic trader who believed that if I could find the best indicator for Volatility 75 index, my trading would improve significantly, but I was mistaken.
In general trading, indicators lag, which is why they should not be employed in isolation.
Indicators should be employed as a supplement to the primary strategy of market structure trading; after doing market analysis, you may apply an indicator depending on your trading strategy for market entry.
There is no best indicator for volatility75 index because all indicators lag; however, when used in conjunction with proper trading understanding, you will begin to see positive results.
Before I conclude for the sake of this post I will give you one exponential moving average I use on a higher timeframe for market entry after I have done my market analysis.
The EMA setting is:
Period: 55
Method: exponential
Shift: 5
Apply: close
Color: use any color of your choice.
In conclusion, regardless of the indicator you choose make sure you first apply market structure and market analysis as V75 index is all about technical analysis trading.
MOST VOLATILE SYNTHETIC INDICES

In my years and experience trading synthetic indices, three of these indices come to be the most volatile which are:
- Volatility 75
- Volatility 50(1s)
- Volatility 100
MINIMUM LOT SIZE FOR VOLATILITY 75 INDEX
The minimum lot size for volatility 75 index is 0.001.
LOT SIZES FOR SYNTHETIC INDICES
Synthetic indices are volatile by design; some of these indices like V75 can give good profit in a short time with their minimum lot size.
Below is a table of synthetic indices and their minimum lot sizes;
| INSTRUMENT | MINIMUM LOT SIZE |
| Volatility 10 (1s) Index | 0.2 |
| Volatility 25 (1s) Index | 0.005 |
| Volatility 50 (1s) Index | 0.005 |
| Volatility 75 (1s) Index | 0.005 |
| Volatility 100 (1s) Index | 0.1 |
| Volatility 200 (1s) Index | 0.02 |
| Volatility 300 (1s) Index | 1.0 |
| Volatility 10 Index | 0.3 |
| Volatility 25 Index | 0.5 |
| Volatility 50 Index | 3.0 |
| Volatility 75 Index | 0.001 |
| Volatility 100 Index | 0.2 |
| Boom 1000 Index | 0.2 |
| Boom 500 Index | 0.2 |
| Boom 300 Index | 0.1 |
| Crash 1000 Index | 0.2 |
| Crash 500 Index | 0.2 |
| Crash 300 Index | 0.05 |
| Jump 10 Index | 0.01 |
| Jump 25 Index | 0.01 |
| Jump 50 Index | 0.01 |
| Jump 75 Index | 0.01 |
| Jump 100 Index | 0.01 |
| Step Index | 0.1 |
| Range Break 100 Index | 0.01 |
| Range Break 200 Index | 0.01 |
These minimum lot sizes are subject to change and can be reviewed by brokers in the future.
VOLATILITY 75 INDEX LOT SIZE CALCULATOR
Deriv broker has a pip value calculator for synthetic indices that can help you manage your risk. Click the link to calculate pips for V75.
WHAT TIME DOES VOLATILITY INDEX OPEN?
Volatility index (synthetic) on Deriv trades 24/7 holidays included.
WHICH BROKER IS BEST FOR VOLATILITY INDEX?
There are a bunch of brokers you can trade VIX on:
· IG
· Etoro
· IC market
· Pepperstone
· Plus500
HOW DO YOU TRADE A VOLATILITY INDEX?
Volatility index (synthetic) can be traded just like any other trading instrument. Buy or sell.
WHAT TIME DOES VOLATILITY INDEX OPEN?
Volatility index is of two types:
VIX: Opens between 2:15 a.m. CT and 8:15 a.m. CT and between 8:30 a.m. CT and 3:15 p.m.
While Deriv synthetic Volatility is a 24/7 market with holidays included.


