Imagine you’re at your trading desk on a quiet Sunday evening, watching the Volatility 75 index paint perfect patterns on your MT5 platform while traditional forex markets sleep.
There’s something almost hypnotic about V75’s relentless movement it never stops, never gaps, and certainly never takes a holiday.
Unlike your typical EUR/GBP pair that might crawl sideways for hours, the V75 is a creature of constant motion, designed to deliver exactly what its name promises: volatility.
But here’s where most traders get it wrong. They approach this synthetic beast with the same lackadaisical attitude they’d bring to a Sunday afternoon punt on the football.
They see the constant movement as easy money, not realizing that how to trade Deriv Volatility 75 index on MT5 requires a completely different mindset and approach than traditional forex pairs.
The V75 doesn’t care about your morning coffee ritual, the Bank of England’s latest announcement, or whether there’s a trade war brewing between superpowers.
It’s pure technical analysis in its rawest form a mathematical model that responds only to supply, demand, and the eternal dance between buyers and sellers.
But what if I told you there’s a systematic approach that can turn this seemingly chaotic instrument into your most reliable profit generator?
- UNDERSTANDING THE VOLATILITY 75 INDEX: YOUR TECHNICAL PLAYGROUND
- SETTING UP YOUR MT5 PLATFORM FOR V75 TRADING
- MARKET STRUCTURE: THE FOUNDATION OF V75 SUCCESS
- SYNTHETIC TRADING STRATEGIES: MASTERING THE V75
- ORDER BLOCK ANALYSIS IN V75 TRADING
- DERIV VOLATILITY 75 INDEX STRATEGIES: ADVANCED TECHNIQUES
- HOW TO MAKE DAILY PROFIT IN DERIV VOLATILITY 75
- BEST TIME TO TRADE DERIV VOLATILITY INDICES
- TECHNICAL ANALYSIS MASTERY FOR V75
- ADVANCED RISK MANAGEMENT TECHNIQUES
- CONTEXT TRADING ON DERIV VOLATILITY 75 INDEX
- PLATFORM OPTIMISATION AND TOOLS
- COMMON MISTAKES AND HOW TO AVOID THEM
- IS DERIV VOLATILITY 75 INDEX PROFITABLE?
- BUILDING YOUR V75 TRADING PLAN
- TECHNOLOGY AND TOOLS FOR V75 TRADING
- FUTURE OF V75 TRADING
- CONCLUSION: YOUR PATH TO V75 MASTERY

UNDERSTANDING THE VOLATILITY 75 INDEX: YOUR TECHNICAL PLAYGROUND
Before we dive into the nitty-gritty of how to trade Deriv Volatility 75 index on MT5, let’s establish what makes this instrument tick.
The V75 is a synthetic index created by Deriv (binary.com), designed to simulate market movements with approximately 75% annualised volatility.
Think of it as a laboratory-perfect trading environment where technical analysis reigns supreme.
Unlike traditional currency pairs that can be influenced by everything from political speeches to economic data releases, the V75 operates in a pure technical vacuum.
This makes it both a blessing and a curse. It’s a blessing because your analysis won’t be derailed by an unexpected central bank announcement.
It’s a curse because there’s nowhere to hide if your technical analysis is flawed, the market will expose it ruthlessly.
The V75 Advantage: Why Traders Love It
24/7 Trading Availability The V75 never sleeps. While forex markets close for weekends, V75 keeps moving, offering continuous trading opportunities for those who understand its patterns.
No Fundamental Interference Forget about NFP Fridays or central bank meetings. The V75 doesn’t care about real-world events, making it a pure technical trader’s paradise.
Consistent Volatility The mathematical model ensures reliable volatility, meaning you won’t find yourself stuck in weeks-long consolidations like you might with traditional pairs.
Predictable Behaviour Being a synthetic instrument, V75 follows mathematical principles rather than human emotions, creating more predictable patterns for those who know how to read them.
SETTING UP YOUR MT5 PLATFORM FOR V75 TRADING
Getting your MT5 platform ready for V75 trading is your first crucial step. Here’s how to add the Volatility 75 index to your charts:
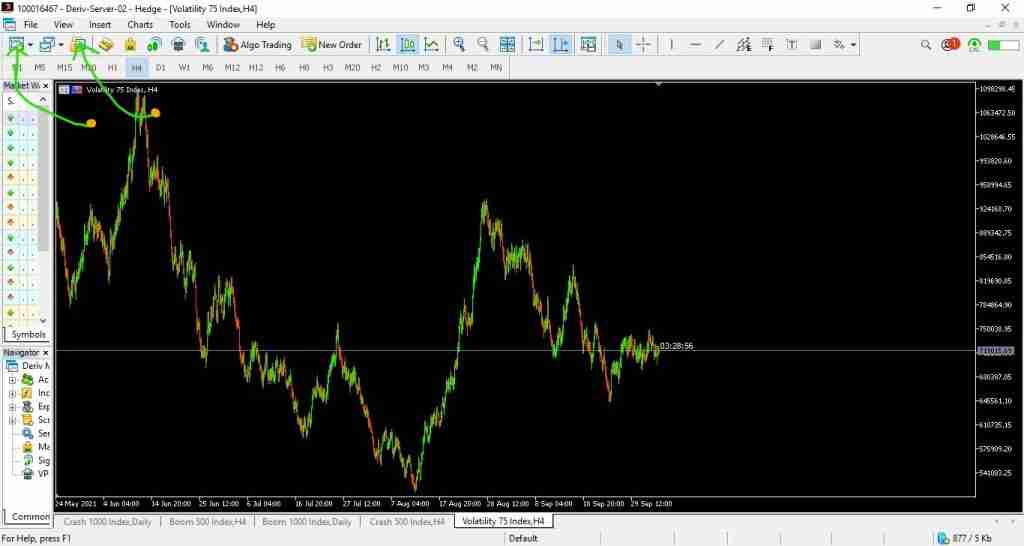
On PC/Desktop:
- Open your MT5 platform
- Look for the chart icon in the top toolbar (or press Ctrl+U)
- In the symbol list, navigate to “Synthetic Indices”
- Select “Volatility 75 Index”
- Right-click and choose “Show Symbol”
On Mobile:
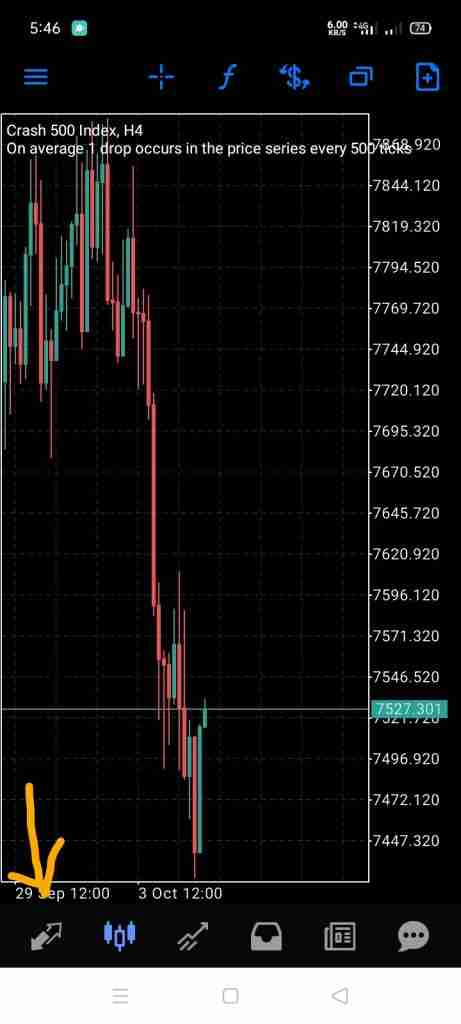
- Open the MT5 app
- Tap the two opposite arrows at the bottom left
- Tap the plus sign (+) in the top right corner
- Search for “Volatility 75” or browse Synthetic Indices
- Add to your watchlist
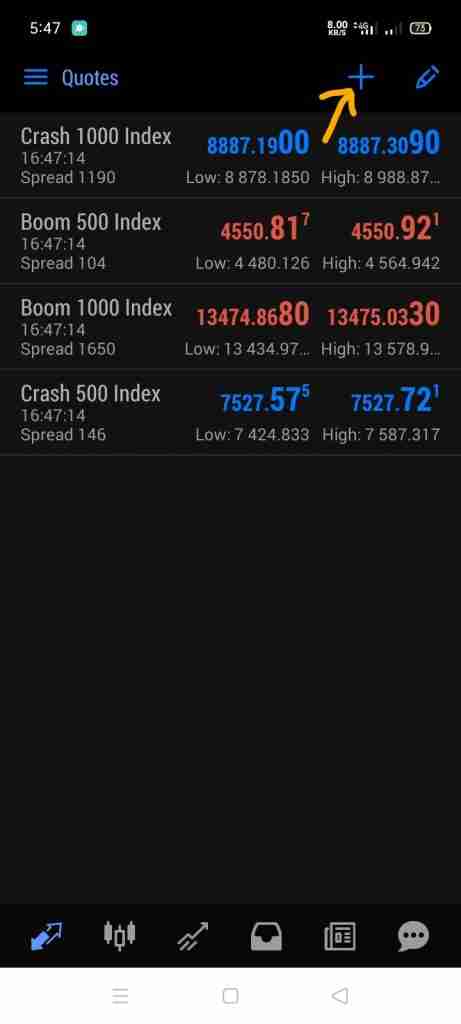
Pro Tip: Set up multiple timeframes simultaneously. I recommend having D1, H4, H1, and M15 charts open for comprehensive analysis.
MARKET STRUCTURE: THE FOUNDATION OF V75 SUCCESS
Understanding market structure is the cornerstone of successful V75 trading. This isn’t just another buzzword it’s the fundamental principle that separates profitable traders from the rest.
Market structure in V75 trading refers to the way price creates patterns of support and resistance, trends, and reversal points.
Key Market Structure Elements
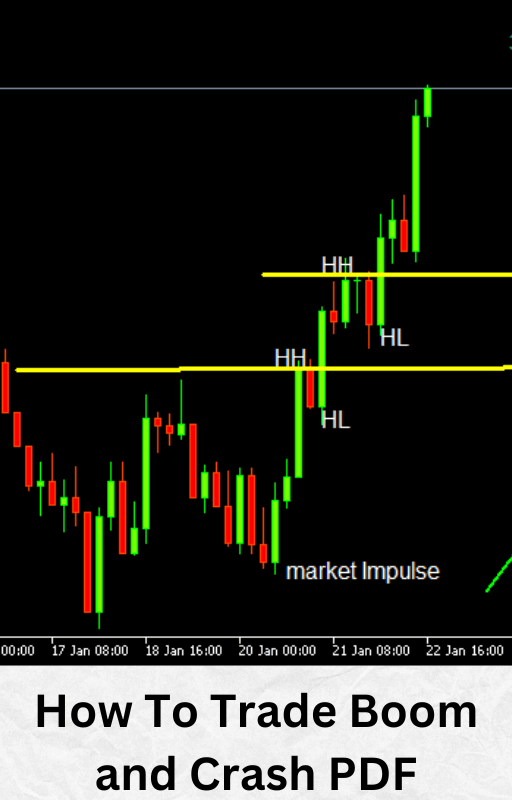
Higher Highs and Higher Lows (Uptrend) In an uptrend, price consistently makes peaks that are higher than the previous peaks, and troughs that are higher than previous troughs. This creates a staircase-like pattern ascending to the right.
Lower Highs and Lower Lows (Downtrend) The opposite of an uptrend, where each peak is lower than the previous peak, and each trough is lower than the previous trough.
Ranging Market (Sideways Movement) Price oscillates between defined support and resistance levels without establishing a clear directional bias.
The Break of Structure Strategy
This is where the magic happens. A break of structure occurs when price violates a significant swing high or low, indicating a potential trend change or continuation.
In V75 trading, these breaks often lead to substantial moves that can be captured with proper positioning.
Bullish Break of Structure:
- Price breaks above a previous significant high
- Often accompanied by increased momentum
- Signals potential uptrend continuation or reversal from downtrend
Bearish Break of Structure:
- Price breaks below a previous significant low
- Usually indicates strong selling pressure
- Suggests downtrend continuation or reversal from uptrend
SYNTHETIC TRADING STRATEGIES: MASTERING THE V75
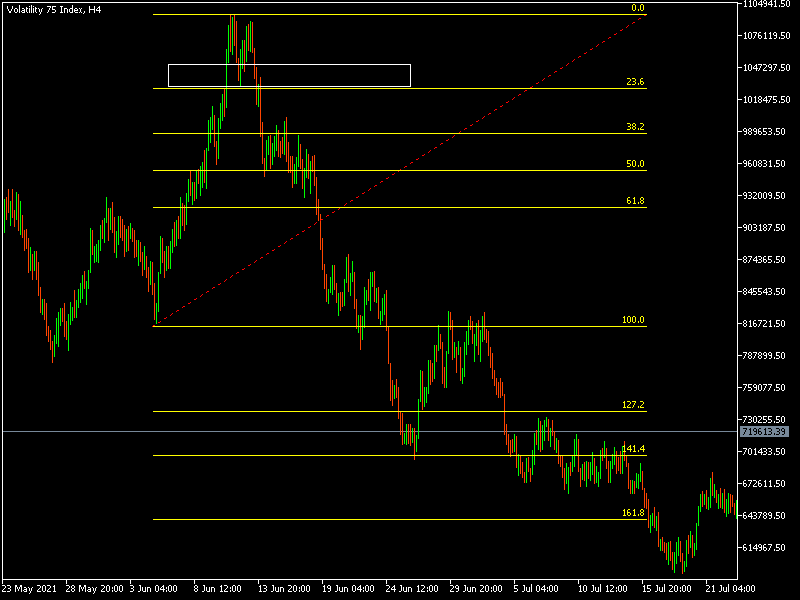
Synthetic trading strategies for V75 require a different approach than traditional forex strategies. The constant volatility and lack of fundamental interference create unique opportunities that don’t exist in conventional markets.
The Trend Continuation Strategy
This strategy capitalises on V75’s tendency to maintain trends once they’re established. Here’s how to implement it:
Setup Requirements:
- Identify the dominant trend on H4 timeframe
- Wait for a pullback to a significant support/resistance level
- Look for rejection signals (pin bars, engulfing patterns)
- Enter on the break of the pullback structure
Entry Criteria:
- Clear trend established on higher timeframe
- Pullback to 38.2% or 50% Fibonacci level
- Rejection candle formation
- Break of pullback structure
The Reversal Strategy
V75’s mathematical nature makes it excellent for reversal trading at key levels.
Reversal Setup Process:
- Identify overextended moves using RSI divergence
- Look for double tops/bottoms at significant levels
- Wait for break of structure in opposite direction
- Enter with tight stops above/below the reversal level
| Strategy Type | Best Timeframe | Win Rate | Risk/Reward | Complexity |
| Trend Continuation | H1-H4 | 65-70% | 1:3 | Medium |
| Reversal | M15-H1 | 55-60% | 1:4 | High |
| Breakout | M15-H1 | 60-65% | 1:2.5 | Low |
| Range Trading | M15-M30 | 70-75% | 1:2 | Medium |
BEST TIME TO TRADE VOLATILITY INDICES
ORDER BLOCK ANALYSIS IN V75 TRADING
Order blocks are institutional footprints left in the market areas where large orders were executed, creating imbalances that price must eventually return to address.
In V75 trading, these blocks serve as high-probability reversal zones.
Identifying Order Blocks
Bullish Order Block:
- Last bearish candle before a strong bullish move
- Usually found at the bottom of downtrends
- Acts as support when price returns
Bearish Order Block:
- Last bullish candle before a strong bearish move
- Typically located at the top of uptrends
- Functions as resistance upon retest
Trading Order Blocks
Entry Process:
- Identify strong moves on M15 or H1 timeframes
- Mark the order block (last opposing candle)
- Wait for price to return to the block
- Look for rejection signals
- Enter with stops beyond the block
Risk Management:
Risk-reward ratio: Minimum 1:2
Stop loss: 10-20 pips beyond the order block
Take profit: Next significant structure level
DERIV VOLATILITY 75 INDEX STRATEGIES: ADVANCED TECHNIQUES
Developing comprehensive Deriv Volatility 75 index strategies requires understanding the unique characteristics of this synthetic instrument. Here are the advanced techniques that separate professionals from amateurs:
The Multi-Timeframe Confluence Strategy
Timeframe Hierarchy:
- D1: Overall trend and major support/resistance
- H4: Intermediate trend and structure
- H1: Entry signals and trade management
- M15: Precise entry timing
Execution Steps:
- Analyse D1 for overall bias
- Identify H4 structure levels
- Wait for H1 confirmation signals
- Execute on M15 for optimal entry
The Spike Capture Strategy
V75’s volatile nature creates regular spikes that can be captured with proper timing.
Spike Identification:
- RSI readings above 80 or below 20
- Price touching Bollinger Band extremes
- Divergence between price and momentum
- Break of significant structure levels
Entry Methodology:
- Wait for initial spike completion
- Look for pullback to 50% retracement
- Enter on break of pullback structure
- Target next significant level
HOW TO MAKE DAILY PROFIT IN DERIV VOLATILITY 75
The holy grail question: how to make daily profit in Deriv Volatility 75. While no strategy guarantees daily profits, certain approaches significantly increase your probability of success.
The Daily Profit Framework
Session Planning:
- Analyse higher timeframes before trading
- Identify 2-3 high-probability setups
- Set realistic profit targets (1-3% of account)
- Stick to your plan regardless of emotions
Risk Management Rules:
- Never risk more than 1% per trade
- Maximum 3 trades per day
- If two consecutive losses, stop trading
- Take profits at predetermined levels
Position Sizing for Daily Profits
| Account Size | Daily Risk Target | Position Size | Potential Daily Profit |
| $1000 | 2% ($20) | 0.10 lots | $40-60 |
| $5000 | 2% ($100) | 0.50 lots | $200-300 |
| $10000 | 2% ($200) | 1.00 lots | $400-600 |
Important Note: These are theoretical maximums. Actual results depend on market conditions and execution quality.
BEST TIME TO TRADE DERIV VOLATILITY INDICES
The optimal time to trade V75 is when market structure formations align with the dominant trend across multiple timeframes.
This setup involves identifying the dominant trend direction from higher timeframes, then looking for structure formations on lower timeframes that support this bias before entry.
Personal Schedule Alignment
Since V75 isn’t bound by traditional market hours, your best trading time is when you have mental clarity, no distractions, and sufficient time to properly analyze market structure.
Avoid trading when mentally fatigued or during platform maintenance windows.
Success with V75 comes from structure alignment, not session timing. Focus on multi-timeframe structure analysis that aligns with your personal schedule for optimal performance.
TECHNICAL ANALYSIS MASTERY FOR V75
Essential Technical Tools
Moving Averages:
- 21 EMA: Short-term trend identification
- 55 EMA: Medium-term trend confirmation
- 200 EMA: Long-term trend bias
Oscillators:
- RSI (14): Momentum and divergence analysis
- MACD: Trend confirmation and signal generation
- Stochastic: Overbought/oversold conditions
Support and Resistance:
- Fibonacci Retracements: Key pullback levels
- Pivot Points: Daily support and resistance levels
- Horizontal Levels: Historical support and resistance
Chart Pattern Recognition
Continuation Patterns:
- Flags and pennants
- Triangular consolidations
- Rectangular ranges
Reversal Patterns:
- Double tops and bottoms
- Head and shoulders
- Divergence patterns
ADVANCED RISK MANAGEMENT TECHNIQUES
The 1% Rule Implementation
Never risk more than 1% of your account on any single trade. Here’s how to calculate position size:
Position Size Formula:
Position Size = (Account Balance × Risk Percentage) / (Stop Loss in Pips × Pip Value)
Example:
- Account: $5000
- Risk: 1% ($50)
- Stop Loss: 25 pips
- Pip Value: $1 (for 0.10 lots)
- Position Size: $50 / (25 × $1) = 2 lots maximum
Trade Management Strategies
Partial Profit Taking:
- Close 50% at 1:1 risk-reward
- Move stop to breakeven
- Let remaining position run to target
Trailing Stops:
- Use ATR-based trailing stops
- Adjust based on market volatility
- Avoid over-optimisation
CONTEXT TRADING ON DERIV VOLATILITY 75 INDEX
Context trading on Deriv Volatility 75 index involves adapting your strategy based on current market conditions. Not all strategies work in all market environments.
Market Context Types
Trending Markets:
- Focus on trend continuation setups
- Use pullback entries
- Avoid counter-trend trades
Ranging Markets:
- Trade bounces off support/resistance
- Use mean reversion strategies
- Take profits more aggressively
High Volatility Periods:
- Widen stop losses
- Reduce position sizes
- Focus on breakout strategies
Low Volatility Periods:
- Tighten stop losses
- Increase position sizes slightly
- Focus on range-bound strategies
PLATFORM OPTIMISATION AND TOOLS
MT5 Customisation for V75
Essential Indicators:
- Market structure indicator
- Support/resistance levels
- Fibonacci retracement tool
- RSI with divergence alerts
Chart Setup:
- Clean, uncluttered appearance
- Consistent colour scheme
- Multiple timeframe layout
- Quick access to drawing tools
Automated Trading Considerations
Expert Advisors (EAs):
- Market structure-based EAs
- Risk management automation
- Alert systems for manual trading
- Backtesting capabilities
Important Warning: Never rely solely on automated systems without understanding the underlying strategy.
COMMON MISTAKES AND HOW TO AVOID THEM
The Top 5 V75 Trading Mistakes
1. Overtrading:
- Problem: Taking too many low-quality setups
- Solution: Limit trades to 2-3 high-probability setups daily
2. Ignoring Market Structure:
- Problem: Trading against obvious trends
- Solution: Always check higher timeframe bias first
3. Poor Risk Management:
- Problem: Risking too much per trade
- Solution: Never exceed 1% risk per trade
4. Emotional Trading:
- Problem: Revenge trading after losses
- Solution: Have a clear trading plan and stick to it
5. Lack of Patience:
- Problem: Forcing trades when none exist
- Solution: Wait for proper setups even if it means no trades
IS DERIV VOLATILITY 75 INDEX PROFITABLE?
The million-pound question: Is Deriv Volatility 75 index profitable? The answer isn’t straightforward—it depends entirely on your approach, discipline, and understanding of the instrument.
Profitability Factors
Positive Factors:
- Pure technical analysis environment
- 24/7 trading availability
- Consistent volatility patterns
- No fundamental interference
- Predictable mathematical behaviour
Challenging Factors:
- High volatility can lead to large losses
- Requires solid technical analysis skills
- Can be psychologically demanding
- No fundamental analysis edge available
Success Statistics
Based on various trading communities and forums:
- Profitable Traders: Approximately 15-20%
- Break-even Traders: Around 10-15%
- Losing Traders: 65-75%
These statistics mirror traditional forex trading, emphasizing that success depends on skill, not the instrument itself.
BUILDING YOUR V75 TRADING PLAN
Essential Plan Components
Market Analysis Framework:
- Daily bias determination
- Key level identification
- Setup recognition criteria
- Entry and exit rules
Risk Management Protocol:
- Maximum daily loss limit
- Position sizing rules
- Stop loss placement
- Profit-taking strategy
Performance Tracking:
- Trade journal maintenance
- Monthly performance review
- Strategy refinement process
- Psychological assessment
Sample Trading Rules
Entry Criteria:
- Clear trend on H4 timeframe
- Structure break confirmation
- Risk-reward minimum 1:2
- Confluence of at least 2 factors
Exit Criteria:
- Stop loss: Structure-based
- Take profit: Next significant level
- Time-based exit: End of trading session
- Trailing stop: After 1:1 achieved
TECHNOLOGY AND TOOLS FOR V75 TRADING
Recommended Software
Trading Platforms:
- MetaTrader 5 (primary)
- TradingView (analysis)
- Deriv web platform (backup)
Analysis Tools:
- Market structure indicators
- Fibonacci tools
- Support/resistance scripts
- Volatility calculators
Risk Management Apps:
- Position size calculators
- Risk-reward calculators
- Trading journal software
- Performance tracking tools
FUTURE OF V75 TRADING
Emerging Trends
Algorithmic Trading:
- Increased use of EAs
- Machine learning applications
- High-frequency trading adaptation
- Artificial intelligence integration
Social Trading:
- Copy trading platforms
- Signal services
- Community-based strategies
- Collaborative analysis tools
Mobile Trading:
- Enhanced mobile platforms
- Real-time notifications
- Cloud-based analysis
- Cross-device synchronisation
CONCLUSION: YOUR PATH TO V75 MASTERY
How to trade Deriv Volatility 75 index on MT5 isn’t just about understanding the mechanics it’s about developing a comprehensive approach that combines technical expertise with psychological discipline.
The V75 offers a unique trading environment where pure technical analysis reigns supreme, but this also means there’s nowhere to hide if your skills aren’t up to par.
The strategies and techniques outlined in this guide provide a solid foundation, but remember that consistency comes from practice, patience, and continuous learning.
The traders who succeed with V75 aren’t necessarily the smartest or the most sophisticated they’re the most disciplined and methodical in their approach.
Key Takeaways:
- Master market structure before anything else
- Develop a systematic approach to trade identification
- Implement robust risk management from day one
- Focus on quality setups over quantity
- Maintain detailed records of your trading performance
Your Next Steps:
- Set up your MT5 platform with proper V75 access
- Practice market structure identification on demo accounts
- Develop and backtest your trading strategies
- Start with small position sizes on live accounts
- Keep detailed records and continuously refine your approach
The V75 will always be there, offering its relentless volatility and opportunities. The question is: will you approach it as a disciplined professional or as another hopeful amateur?
The choice and the results—are entirely in your hands.
Ready to begin your V75 journey? Start with a demo account, apply these principles systematically, and remember that in the world of synthetic indices, patience and precision are your greatest assets.
The market rewards those who respect its power and approach it with the seriousness it deserves.
Remember: Trading involves substantial risk and is not suitable for all investors. Past performance doesn’t guarantee future results. Always trade with money you can afford to lose and consider seeking professional financial advice.


Excellent article its all about market structure
Thanks for dropping in.
Nice article
Thanks so much. Am glad you enjoyed it.