The final goal of this post is to reveal how to trade boom and crash without indicators.
Many traders believe that having the appropriate indicators is essential to trading success; some even go so far as to have many indicators on their charts. The truth is that having too many indicators on your chart can make you even more confused.
Indicators generally lag, which is why they should be utilized as a backup choice following market structure analysis.
For the record, indicators are not bad; what is bad is having too many of them on your chart. You want to keep things as basic as possible.
At the end of the day, you want to be able to recognize the dominating trend of the market and to do so, you must apply indicators correctly, and to apply indications correctly, you must first understand market structure.
- DOES BOOM AND CRASH SPIKE DETECTOR INDICATOR WORK?
- HOW TO TRADE BOOM AND CRASH WITHOUT INDICATORS.
- BOOM AND CRASH SUPPORT AND RESISTANCE
- BOOM AND CRASH LOT SIZE CALCULATOR
- IS BOOM AND CRASH MANIPULATED?
- BOOM AND CRASH MARKET STRUCTURE
- HOW TO CATCH SPIKES ON BOOM AND CRASH WITHOUT INDICATORS
- BEST BOOM AND CRASH SPIKE STRATEGY
- IS IT SAFE TO TRADE BOOM AND CRASH ON WEEKENDS?
- CONCLUSION

DOES BOOM AND CRASH SPIKE DETECTOR INDICATOR WORK?
As a trader, the sooner you stop relying on fancy indicators, the sooner you can start focusing on what counts.
To begin with, there is no perfect trading indicator that will provide you the profit you desire; after all, if it truly works, why are they selling it to everyone?
I’m being so loud because I’ve had my fair share of buying indications that don’t live up to their hype.
However, if you insist on getting a boom and crash spike detector, it is critical that you first comprehend the right trading principles, as this will help you make the appropriate decision when employing the boom and crash spike detector in your trading.

READ ALSO: CRASH 500 INDEX
READ ALSO: CRASH 1000 BROKER
HOW TO TRADE BOOM AND CRASH WITHOUT INDICATORS.

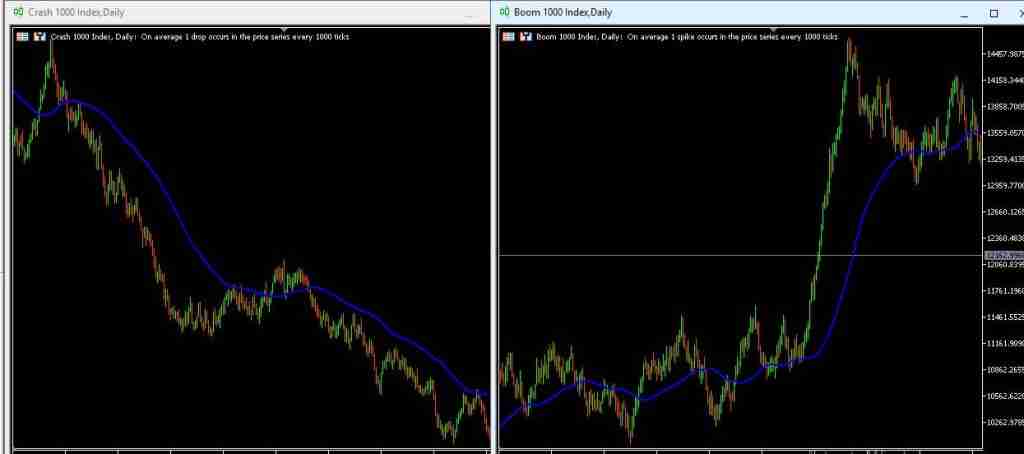
To effectively trade boom and crash without indicators is to focus on the naked chart on a higher timeframe and utilize the default tools available on MT5.
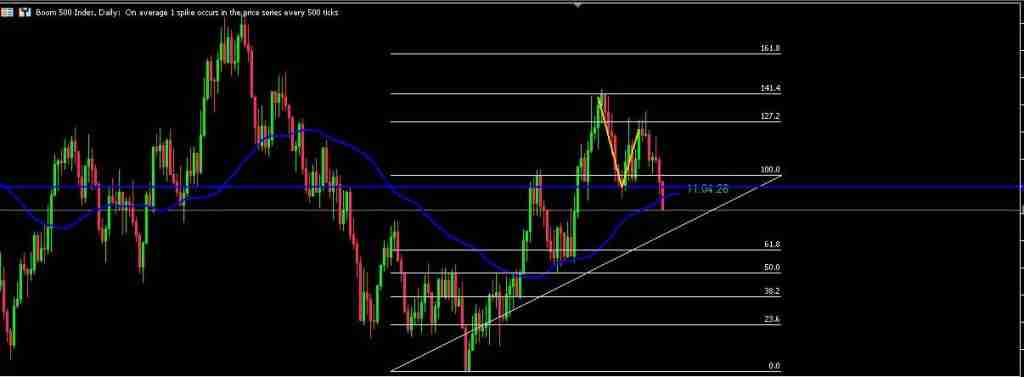
In addition, here are the tools necessary for proper market analysis to trade boom and crash with indicators:
- Trendline
- Horizontal line
- Fibonacci tool
Your ability to combine these tools for market analysis shows that you understand the market structure.
TRENDLINE
The trendline is useful in identifying dominant trends and breakouts (preferably on a higher timeframe).
HORIZONTAL LINE
A horizontal line helps you mark areas of support and resistance. (Preferably on a higher timeframe)
NOTE: when horizontal line and trendline are used together, it can become a strong entry forming a confluence.
FIBONACCI TOOL
The Fibonacci tool helps spot possible areas of retracement and price reversal.
BOOM AND CRASH SUPPORT AND RESISTANCE
Support and resistance is an inevitable part of trading, it is seen across all timeframes and trading instruments and the same goes for trading support and resistance in boom and crash.
For consistency, it is much better to trade boom and crash support and resistance at a higher time as this will give you a broader perspective of the dominant trend.
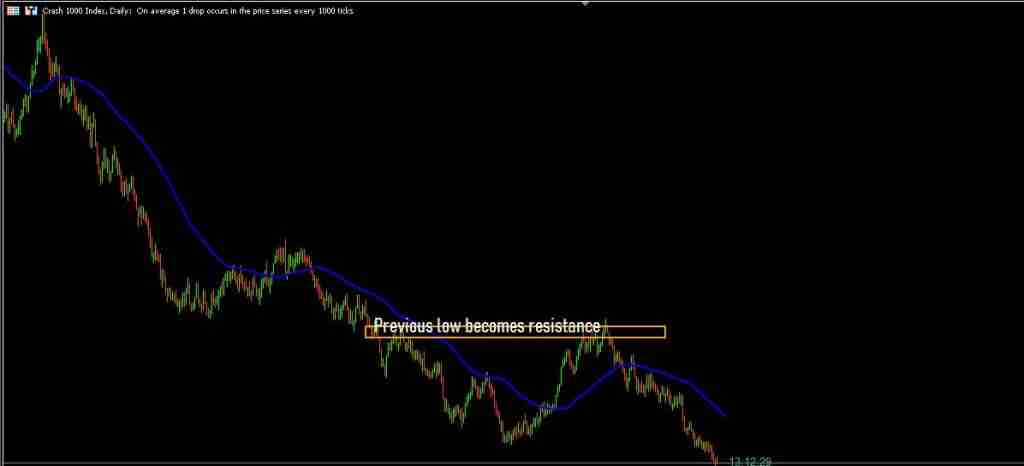
Support and resistance in boom and crash are best seen on previous highs and lows however they should not be traded in isolation, you will need to apply other tools and trading principles needed based on the market condition of the present market.
In conclusion, trade boom and crash support and resistance first
- Identify the trend (on a higher timeframe)
- Join the trend on a support or resistance level (retracement)
- Exit trade at the next support and resistance zone
Below is an image example of boom and crash support and resistance:

BOOM AND CRASH LOT SIZE CALCULATOR
The boom and crash lot size calculator estimates the pip value in your trades, allowing you to better manage your risk.
The pip value for a contract on DMT5 is computed using the following formula:
Pip value = point value × volume × contract size.
The pip value is calculated in USD.
Here is the boom and crash lot size calculator.
IS BOOM AND CRASH MANIPULATED?
Concerning this big question whatever the answer is wouldn’t matter as there will always be mixed reactions concerning synthetic indices as many boom and crash traders who keep losing money think they are been monitored and I understand their frustration.
To begin with, as a boom and crash trader, it will do you much good to get rid of this mindset of manipulation as this will rob you of any possibility of being successful at trading boom and crash.
The little research I did showed that traders who think boom and crash are manipulated have poor trading knowledge and strategy, one of these poor strategies is trading every day.
A lot of boom and crash traders think taking multiple trades is where the money is; also many boom and crash traders lack the patience to wait for a good setup to appear which might take days to weeks, and they are in a hurry to make it big.
I cannot confirm or deny whether the boom and crash indices are manipulated, but one thing is certain: if you have a good understanding of the market structure, patience, and stay on higher timeframes, you will begin to see a consistent profit on boom and crash trading because they are not affected by global events.
BOOM AND CRASH MARKET STRUCTURE

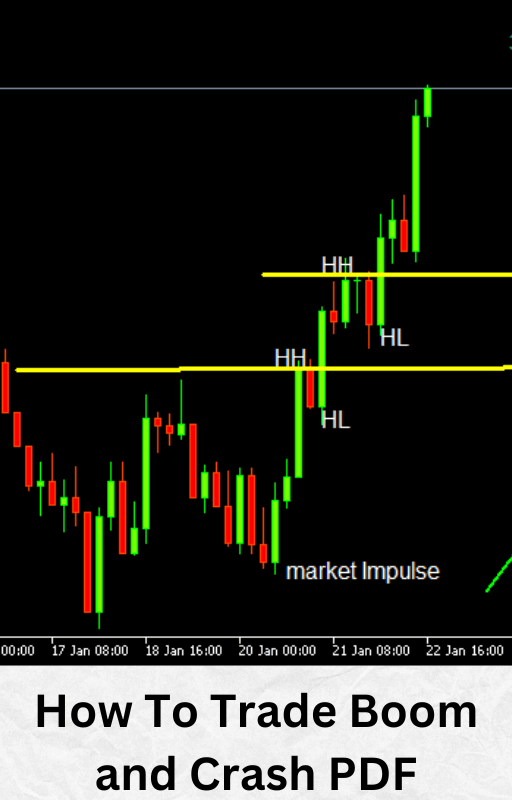
The boom and crash indices are constantly forming structures from support and resistance to chart patterns, candlestick engulfing, higher highs, lower low, and more.
All these put together constitute market structure, and boom and crash indices are designed to function without global events interference which makes it perfect for technical analysis trading.
Boom and crash analysis is best done on a higher time frame to see a well-defined boom and crash market structure.
HOW TO CATCH SPIKES ON BOOM AND CRASH WITHOUT INDICATORS
If you have not developed patience as a trader, it will be difficult for you to become successful at trading boom and crash.
Since boom and crash indices are designed for spikes and drops, it is difficult to tell when exactly the spikes will happen.
That being said to catch spikes on boom and crash the right way is to focus on long-term trading, this will filter the noise, present fewer entries, and highlight a strong setup that is needed for consistent profit.
For a quick summary, this is how to catch spikes on boom and crash the right way
- Focus on a higher timeframe
- Spot support and resistance levels
- Wait for a breakout of support/resistance levels and possible retest before entry.
BEST BOOM AND CRASH SPIKE STRATEGY
The best boom and crash spike strategies are to be traded on higher timeframes because on higher timeframes you can tell the dominant trend and follow the trend.
Spikes on lower timeframes are not as consistent as on higher timeframes.
IS IT SAFE TO TRADE BOOM AND CRASH ON WEEKENDS?
It is 100% safe to trade boom and crash on weekends as it is one of its advantages over currency trading.
CONCLUSION
I have said in my previous article that indicators generally lag, this is why your best bet to catch spikes on boom and crash will be on market structure trading. (chart pattern, support, resistance, etc.).
There is something professional traders know which is trading is not a short-term plan. To get a significant result, you have to start thinking long-term, this is how to win. In this industry, patience and knowledge are key even on how to trade boom and crash without indicators.


