You’re watching your favourite football team dominate the first half, but something shifts in the second half.
The momentum changes, the energy drops, and suddenly they’re struggling to maintain their lead. Markets work exactly the same way.
Every trend, no matter how strong, eventually reaches its peak and begins to reverse. The question isn’t whether it will happen it’s whether you’ll spot it before everyone else does.
Understanding how to know when a trend is ending can transform your trading from guesswork into strategic precision. But here’s the thing most traders miss.
- HOW TO KNOW WHEN A TREND IS ENDING-THE FOUR PILLARS OF TREND REVERSAL DETECTION
- WHAT IS THE BEST TIME FRAME TO LOOK FOR MARKET REVERSAL?
- HOW TO SPOT A POSSIBLE MARKET REVERSAL AFTER A LONG MOVE
- DETERMINING FOREX TREND DIRECTION LIKE A PRO
- RECOGNISING WHEN A NEW TREND IS STARTING TO EMERGE
- THE BEST TREND INDICATORS ALREADY IN YOUR MT4
- ADVANCED TIPS FOR TREND REVERSAL TRADING
- COMMON MISTAKES TO AVOID
- PUTTING IT ALL TOGETHER: A COMPLETE REVERSAL TRADING FRAMEWORK
- CONCLUSION: MASTER THE ART OF TREND REVERSAL DETECTION
HOW TO KNOW WHEN A TREND IS ENDING-THE FOUR PILLARS OF TREND REVERSAL DETECTION
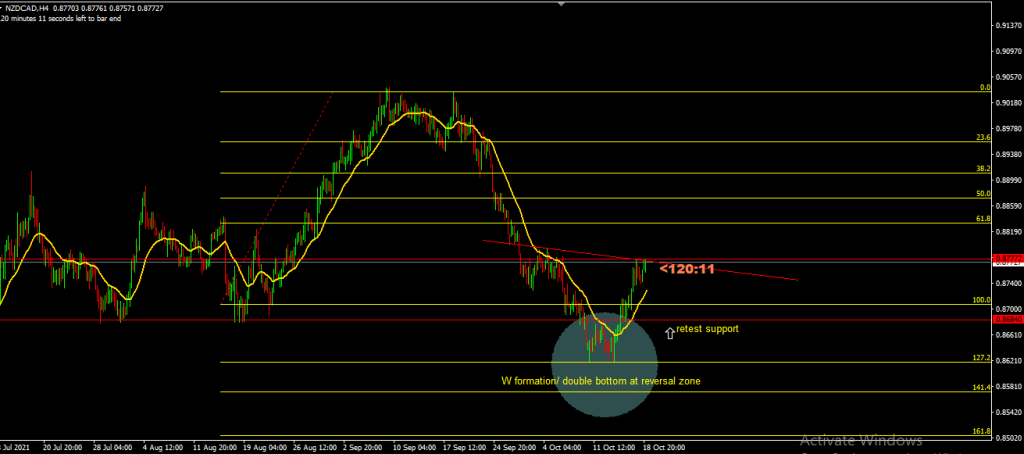
Knowing when a trend is ending isn’t magic it’s methodology.
Professional traders rely on four key techniques that work together like instruments in an orchestra, each playing their part to reveal the market’s next move.
1. The Fibonacci Reversal Zones Method
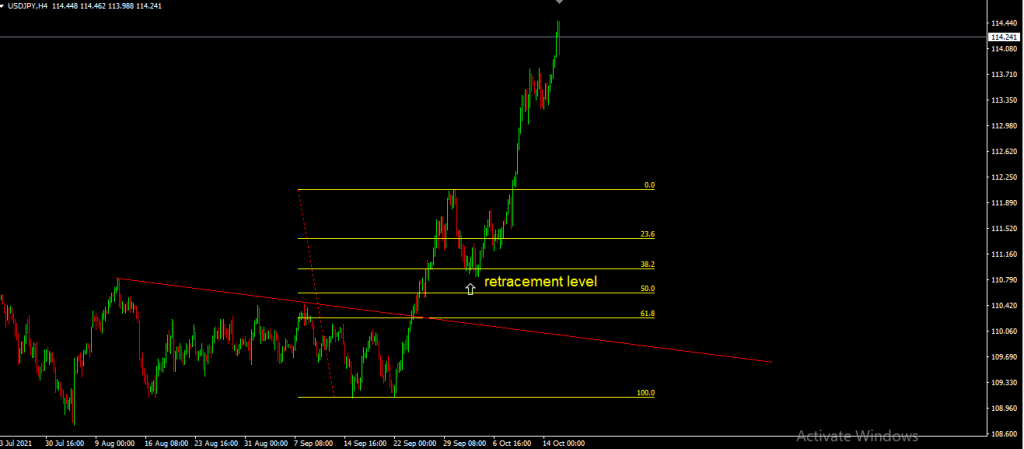
The Fibonacci tool isn’t just another indicator it’s your crystal ball for predicting where trends might exhaust themselves.
When properly applied, Fibonacci retracement levels map out potential reversal zones long before price reaches them.
Key Fibonacci Reversal Levels:
- 127.2% – Primary reversal zone
- 141.4% – Secondary reversal zone
- 161.8% – Major reversal zone
Key Fibonacci Retracement Levels:
- 38.2% – Shallow retracement
- 50.0% – Moderate retracement
- 61.8% – Deep retracement
How to Draw Fibonacci Correctly:
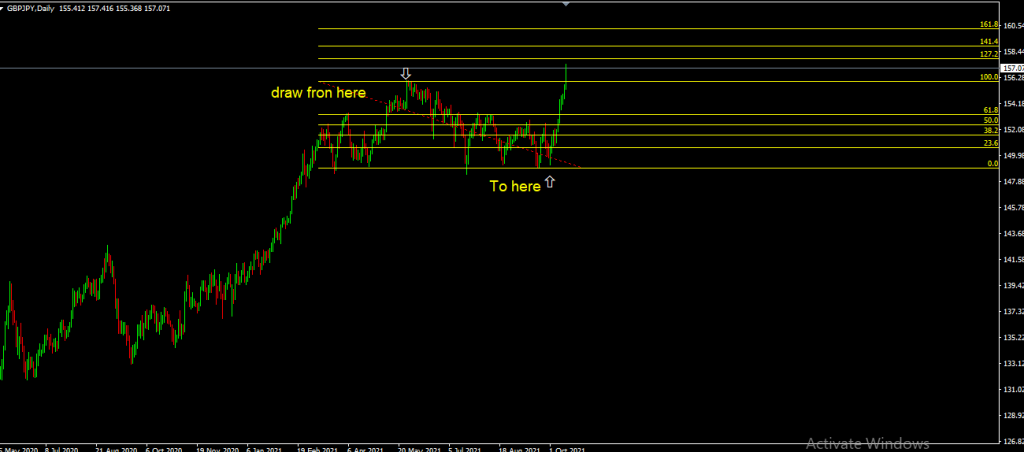
For downtrends: Draw from the highest high to the lowest low For uptrends: Draw from the lowest low to the highest high
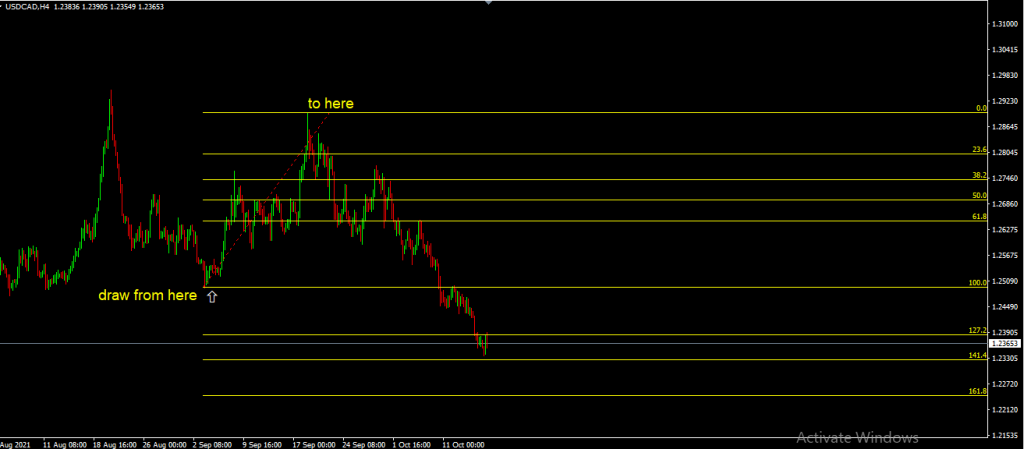
Remember, always zoom out to higher timeframes (H4 or Daily) for the most accurate Fibonacci readings. The bigger picture reveals levels that intraday noise might obscure.
2. Chart Reversal Patterns That Signal Trend Exhaustion
Chart patterns are the market’s way of telegraphing its next move. These formations develop over time and provide reliable signals when trends are losing steam.
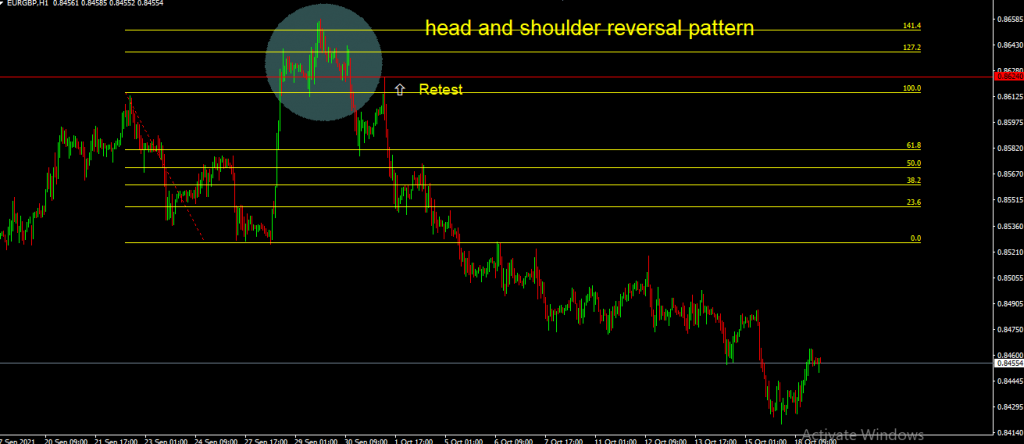
For Uptrend Reversals:

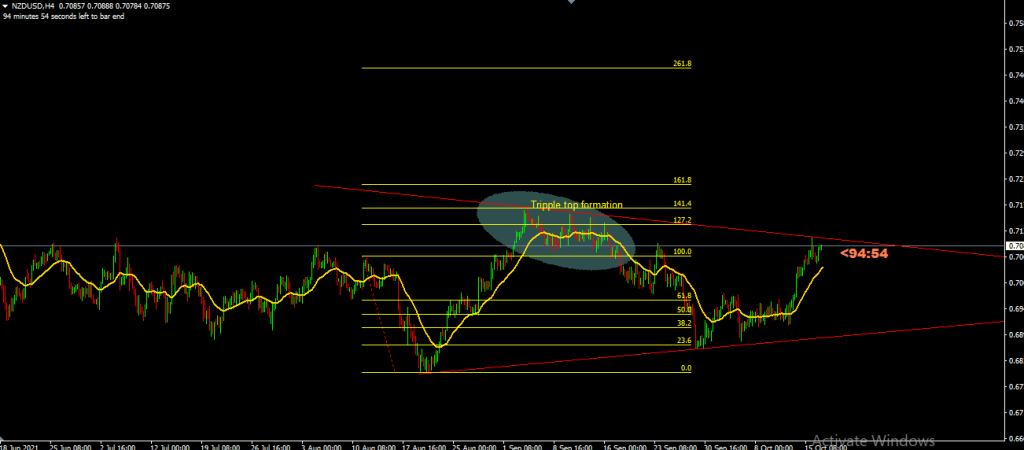
- Head and Shoulders – The classic topping pattern
- Triple Top – Three attempts to break higher, all failing
- M Formation – Double top with clear resistance
For Downtrend Reversals:
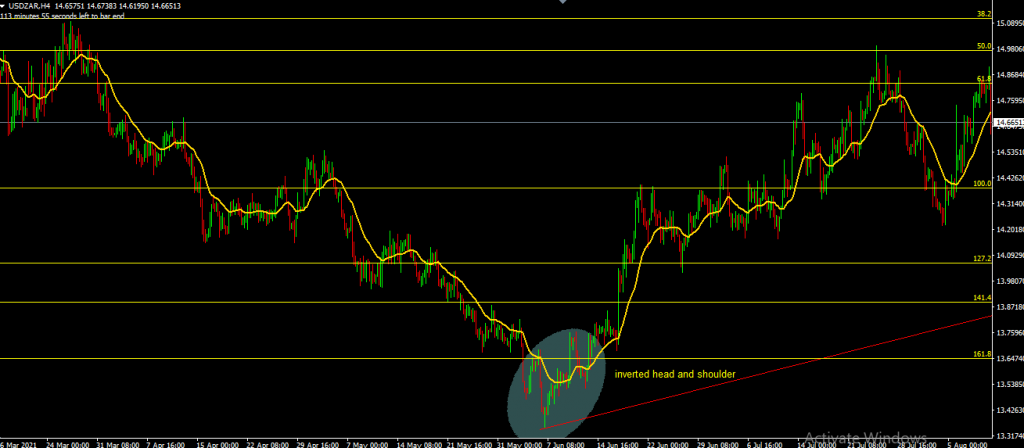
- Inverted Head and Shoulders – The mirror opposite of its bullish cousin

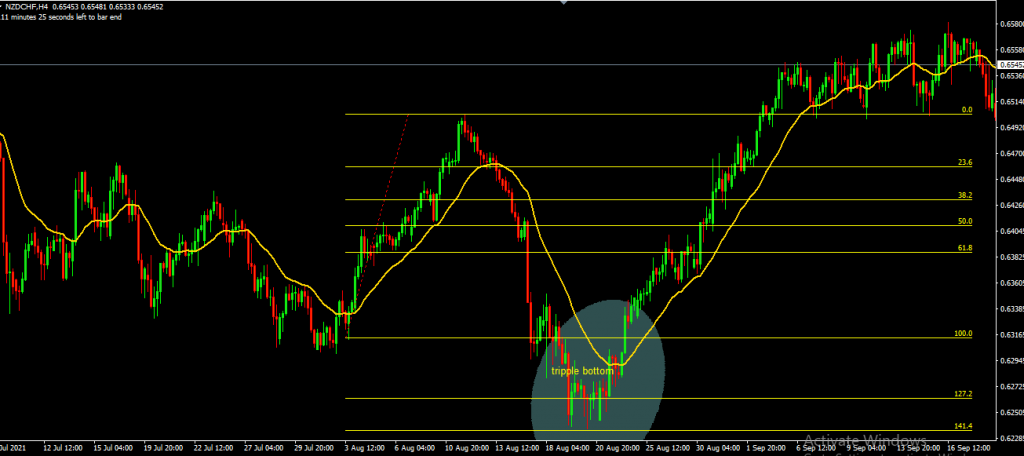
- Triple Bottom – Three failed attempts to break lower
- W Formation – Double bottom with strong support
The beauty of these patterns lies in their psychological foundation. They represent the collective shift in market sentiment from bullish to bearish (or vice versa).
3. Candlestick Pattern Confirmations
Individual candlesticks or small formations can provide early warnings of trend weakness. These patterns work best when they appear at key Fibonacci levels or within chart pattern formations.
Key Reversal Candlestick Patterns:
- Doji candles at key levels
- Hammer and hanging man formations
- Engulfing patterns
- Evening star and morning star formations
4. Trendline and Support/Resistance Breakouts
Sometimes the simplest approach is the most effective. Drawing clean trendlines and identifying key horizontal levels provides clear-cut signals when trends begin to falter.
When a well established trendline breaks with conviction, it often signals the beginning of the end for the current trend. The key is waiting for the breakout, pullback, and confirmation before acting.

WHAT IS THE BEST TIME FRAME TO LOOK FOR MARKET REVERSAL?
Here’s where many traders go wrong they’re looking at the wrong timeframes. How much you can make trading forex often depends on your ability to spot reversals at the right time horizon.
Optimal Timeframes for Reversal Analysis:
- H4 (4-hour) – Ideal for swing traders
- Daily – Best for position traders
- Weekly – For long-term trend analysis
Higher timeframes filter out market noise and provide clearer signals. When you zoom out, patterns become more obvious and false signals decrease dramatically.
HOW TO SPOT A POSSIBLE MARKET REVERSAL AFTER A LONG MOVE
After an extended trend, markets often show telltale signs of exhaustion before reversing. Here’s your checklist for identifying these crucial moments:
Signs of Trend Exhaustion:
- Decreasing momentum – Price moves become smaller despite continued direction
- Divergence with indicators – RSI or MACD showing opposite signals
- Increased volatility – Wild swings suggesting indecision
- Volume changes – Decreasing volume on trend continuation moves
- Time factor – Trends rarely last forever; consider duration
The Three-Step Reversal Confirmation Process:
Step 1: Identify the Setup Look for price approaching key Fibonacci reversal zones (127.2%, 141.4%, or 161.8%) after an extended move.
Step 2: Wait for Pattern Formation Watch for reversal chart patterns or significant candlestick formations at these key levels.
Step 3: Confirm with Breakout Wait for a clear break of the established trendline or key support/resistance level.
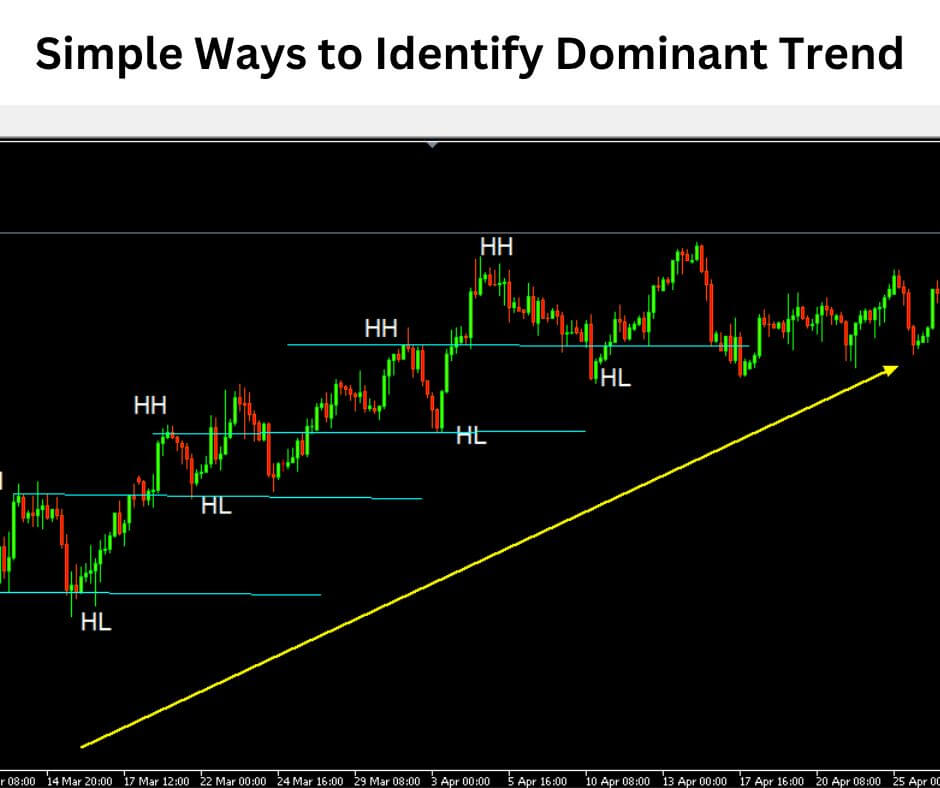
DETERMINING FOREX TREND DIRECTION LIKE A PRO
Before you can spot when a trend is ending, you need to identify the current trend direction accurately. This fundamental skill separates profitable traders from the rest.
The Two-Step Trend Identification Method:
- Switch to higher timeframes (H1 and above)
- Zoom out your chart to see the bigger picture
This simple approach eliminates confusion and reveals the dominant trend direction in any market.
For those wondering how to trade forex with $10, mastering trend identification is crucial for maximising small account potential.
Bullish Trend Characteristics:
- Higher highs and higher lows
- Upward sloping trendline
- Price above key moving averages
Bearish Trend Characteristics:
- Lower highs and lower lows
- Downward sloping trendline
- Price below key moving averages.
RECOGNISING WHEN A NEW TREND IS STARTING TO EMERGE
Trend endings often mark new trend beginnings. Here’s how to position yourself for the next major move:
The Emergence Checklist:
- Fibonacci zone reaction – Price respects key reversal levels
- Pattern breakout – Clear break of reversal formation
- Trendline violation – Old trendline broken with conviction
- Retest completion – Price returns to test the broken level
- Momentum confirmation – New direction shows strength
For traders using very easy and profitable trading strategy on MT4, understanding trend emergence timing can significantly improve entry precision.
THE BEST TREND INDICATORS ALREADY IN YOUR MT4
Stop searching for the holy grail indicator—the best tools are already on your platform:
Essential Built-in Tools:
- Trendlines – Draw them, respect them, trade their breaks
- Horizontal lines – Mark key support and resistance
- Fibonacci retracement – Map reversal and retracement zones
- Candlestick patterns – Read market psychology
- Higher timeframes – Your zoom-out button is your best friend
These simple tools, when combined effectively, provide more reliable signals than any complex indicator system.
ADVANCED TIPS FOR TREND REVERSAL TRADING
Risk Management Essentials:
Understanding how to set stop loss and take profit in MT4 becomes crucial when trading reversals, as these setups can be more volatile than trend continuation trades.
Position Sizing Guidelines:
- Use smaller position sizes for reversal trades
- Place stops beyond key levels, not at round numbers
- Consider partial profit-taking at Fibonacci levels
Timing Your Entries:
The best reversal trades often come from patience. Wait for:
- Multiple confirmations aligning
- Clear pattern completion
- Volume supporting the new direction
COMMON MISTAKES TO AVOID
The Premature Reversal Call: Don’t fight strong trends hoping for reversals. Wait for clear evidence before acting.
Ignoring the Bigger Picture: Always check higher timeframes before taking reversal trades. What looks like a reversal on M15 might just be a pullback on H4.
Over-relying on Indicators: Remember, indicators lag price. Focus on price action and patterns first, then use indicators for confirmation.
PUTTING IT ALL TOGETHER: A COMPLETE REVERSAL TRADING FRAMEWORK
Here’s your step-by-step process for identifying and trading trend endings:
Phase 1: Preparation
- Identify current trend on higher timeframes
- Draw key Fibonacci levels
- Mark important support/resistance zones
Phase 2: Detection
- Monitor price action at key Fibonacci reversal zones
- Watch for reversal chart patterns forming
- Look for candlestick confirmation signals
Phase 3: Confirmation
- Wait for trendline breaks
- Confirm with pattern completion
- Check for momentum divergence
Phase 4: Execution
- Enter on retest of broken level
- Set stop beyond pattern invalidation point
- Target next major Fibonacci level
CONCLUSION: MASTER THE ART OF TREND REVERSAL DETECTION
Knowing when a trend is ending isn’t about predicting the future it’s about reading the present accurately.
The techniques we’ve covered work because they’re based on market psychology and time-tested principles that have guided successful traders for decades.
The Fibonacci tool maps potential reversal zones, chart patterns reveal collective market sentiment, candlestick formations provide timing precision, and trendline breaks offer clear confirmation signals.
When these elements align, they create high-probability reversal opportunities.
Remember, trend reversal trading requires patience and discipline. The best opportunities come to those who wait for proper setups rather than forcing trades.
Start by practising these techniques on demo accounts, focus on higher timeframes for clearer signals, and always manage your risk appropriately.
Your next step: Open your charts right now and identify the current trend in your favourite currency pairs.
Draw your Fibonacci levels, mark key support and resistance, and start watching for the signals we’ve discussed. The market is constantly providing opportunities you just need to know where to look.
What trend reversal signal will you spot first? The market is waiting to reward those who understand its language.
Ready to enhance your trading skills further? Explore our comprehensive guides on forex trading strategies and risk management techniques to build a complete trading arsenal.


