Tradingview has become a staple platform for traders, offering an abundance of tools and resources essential for informed trading decisions.
With access to a wide array of trading instruments and both default and custom indicators, Tradingview stands as a comprehensive platform among other worthy names like Meta Trader.
Among synthetic traders on Deriv, a common query is, “How to find Boom and Crash on TradingView.”
I invite you to explore the realm of synthetic trading with me and discover precisely where to locate the Boom and Crash index on the TradingView platform.
Uncover the insights and features that TradingView provides to enhance your synthetic trading experience.
- HOW TO FIND SYNTHETIC INDICES ON TRADINGVIEW
- HOW TO FIND BOOM AND CRASH ON TRADINGVIEW
- HOW TO ADD VOLATILITY 75 INDEX ON TRADINGVIEW
- CRASH 1000 INDEX CHART TRADINGVIEW
- CRASH 500 INDEX TRADINGVIEW
- BOOM 1000 INDEX LIVE CHART
- BOOM AND CRASH CHART
- WHERE CAN I TRADE BOOM AND CRASH INDICES
- WHICH INDICATOR IS BEST FOR BOOM AND CRASH
- IS DERIV SYNTHETIC INDICES BETTER THAN FOREX
HOW TO FIND SYNTHETIC INDICES ON TRADINGVIEW
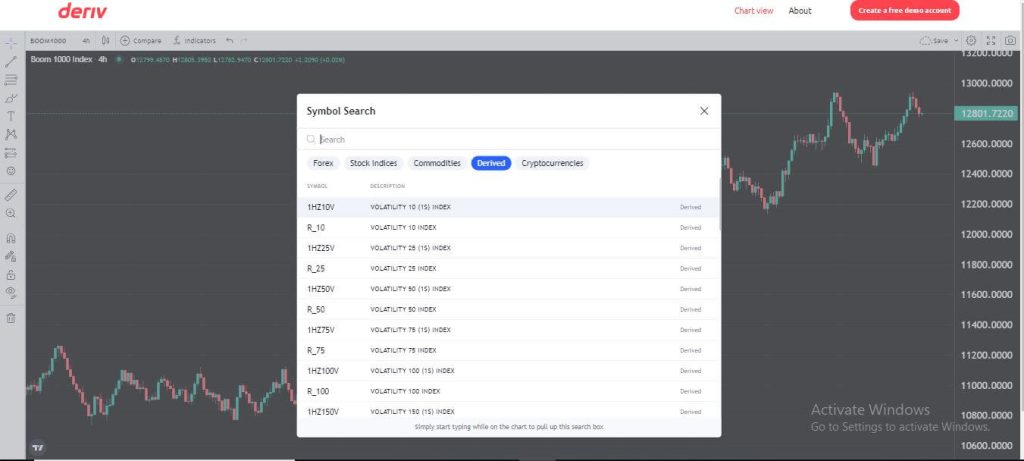
The most straightforward method to locate synthetic indices on TradingView is through TradingView Deriv.
This link provides direct access to the complete array of synthetic instruments.
Additionally, you have the option to personalize your chart by choosing your preferred template.

HOW TO FIND BOOM AND CRASH ON TRADINGVIEW
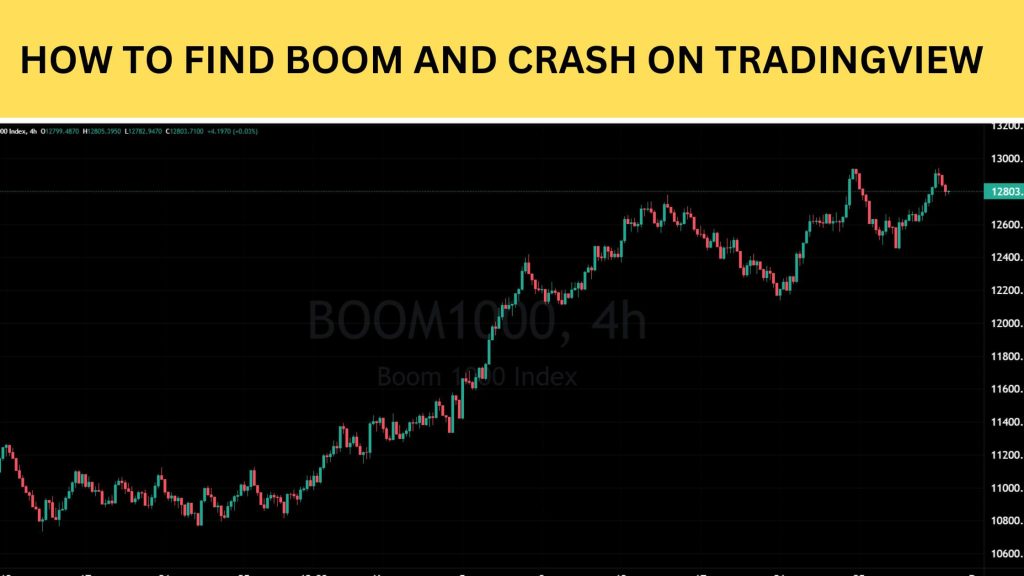
The most straightforward method to locate Boom and Crash on TradingView is through TradingView Deriv.
Once on the platform, navigate to the top left corner, where you can search for your desired symbol. In the list of options that appears, select “Derived,” and there you will find all synthetic indices, including Boom and Crash.
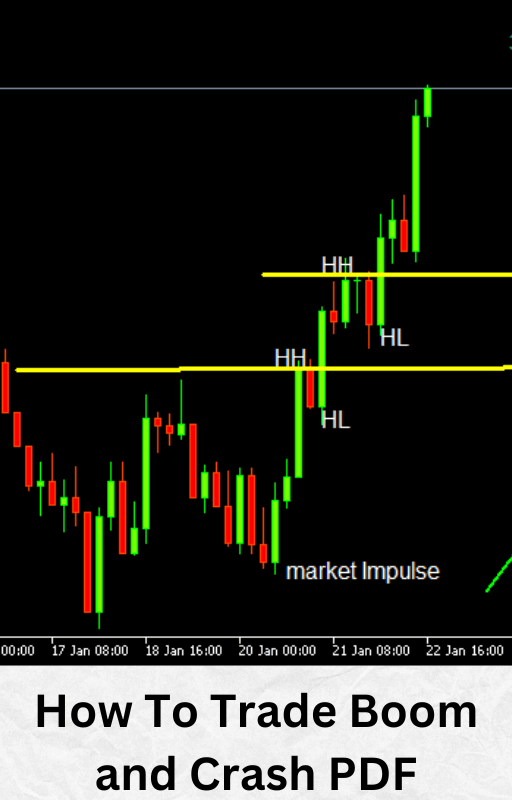
HOW TO ADD VOLATILITY 75 INDEX ON TRADINGVIEW
The simplest method to include the Volatility 75 index on TradingView is to visit the TradingView Deriv Website.
Once there, explore the list of options and select “Derived.” This will display the complete list of synthetic indices available for you to add to your chart.
CRASH 1000 INDEX CHART TRADINGVIEW
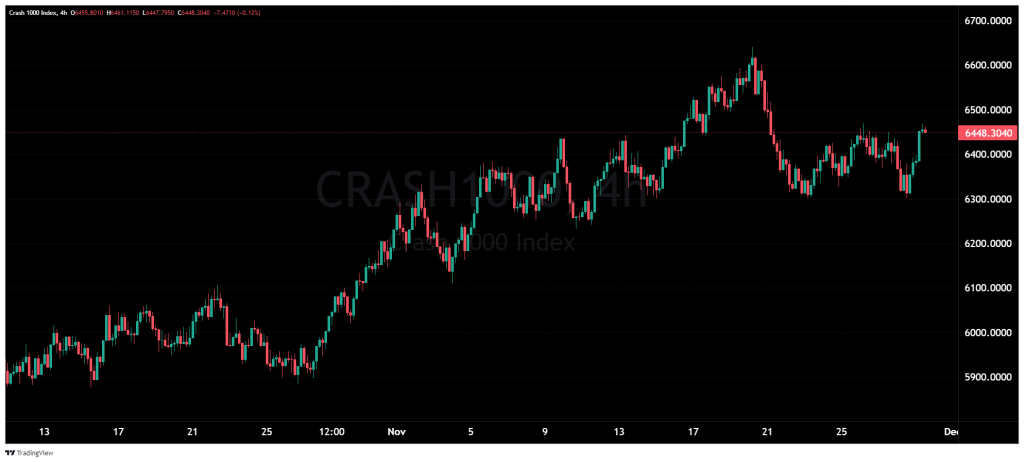
The trading chart for the Crash 1000 index on TradingView is accessible at the TradingView Deriv website above.
Navigate to the chart options and select “Derived” to view the list of available synthetic indices.
Within the Derived option, you will find a comprehensive list of all synthetic indices currently available.
CRASH 500 INDEX TRADINGVIEW
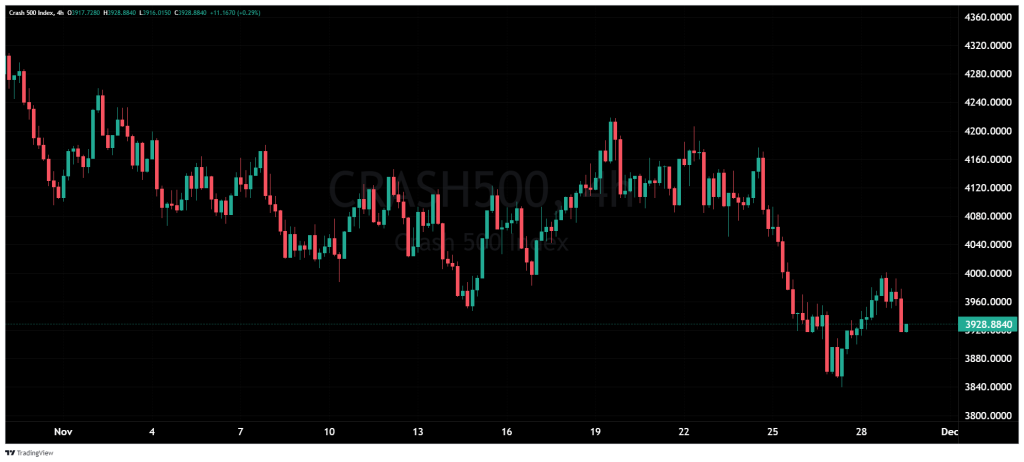
To access the Crash 500 index on TradingView, visit the TradingView Deriv website above.
Once on the platform, choose “Derived” among the options to view all available synthetic indices.
Additionally, you have the flexibility to customize your chart according to your preferences, adjusting its appearance or selecting a desired template.
BOOM 1000 INDEX LIVE CHART
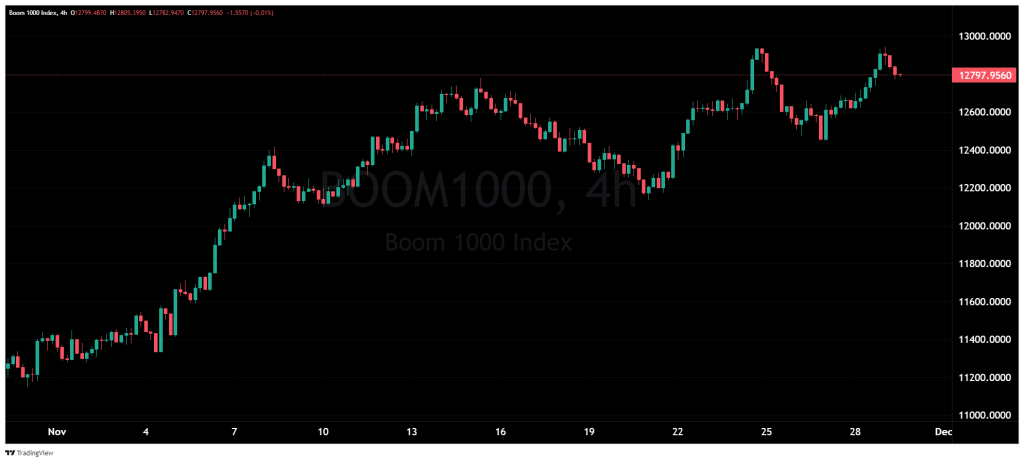
The Boom 1000 index is exclusive to Deriv broker and remains unaffected by global events.
You can see a live chart of Boom 1000 index on the TradingView website.
BOOM AND CRASH CHART
Boom and Crash are unique to Deriv, and you can access them either on MT5 or TradingView. To gain access to MT5, you can register with Deriv with a minimum deposit of $10.
Additionally, you can view the chart at: https://tradingview.deriv.com/deriv.
WHERE CAN I TRADE BOOM AND CRASH INDICES
Exclusively offered by Deriv, the Boom and Crash indices are accessible with a mere $10 sign-up investment.
This not only grants you the ability to trade Boom and Crash but also provides access to an array of other synthetic indices, Forex, stocks, ETFs, cryptocurrencies, and commodities.
Deriv’s platform caters to a diverse range of financial instruments, making it a versatile choice for traders with varying interests.
Whether you are drawn to the unique dynamics of Boom and Crash or wish to explore a broader spectrum of trading opportunities, the low entry requirement and comprehensive asset coverage make Deriv an accessible and inclusive platform for traders seeking diverse investment options.
WHICH INDICATOR IS BEST FOR BOOM AND CRASH
In my years of trading, one undeniable truth emerged: successful traders seldom depend solely on indicators.
This holds for Boom and Crash trading, where there’s no definitive set of “best” indicators. To thrive as a Boom and Crash trader, understanding market psychology and structure is key.
This means mastering movements like rally base rally and drop base drop, utilizing tools like the Fibonacci tool, recognizing chart patterns, and adopting a top-down analysis approach.
Possessing these fundamental skills is crucial for traders aiming for consistent profitability.
In essence, success in Boom and Crash trading lies not in relying on specific indicators but in a comprehensive grasp of market dynamics, making these skills indispensable for those seeking lasting success in the ever-evolving financial market.

IS DERIV SYNTHETIC INDICES BETTER THAN FOREX
Answering this can be challenging as traders will always have individual preferences. However, having experienced both, I can assert that each has its pros and cons.
One advantage of forex is the widespread availability of pairs across all brokers, unlike Deriv synthetic indices exclusive to the Deriv platform.
Conversely, Deriv synthetic indices offer a clear advantage by remaining unaffected by global events, eliminating concerns about sudden price movements.
Trading with Deriv synthetic indices is predominantly based on technical analysis, providing a distinct approach compared to the broader factors that influence forex.
In essence, the choice between forex and Deriv synthetic indices depends on individual priorities.


Leave a Reply