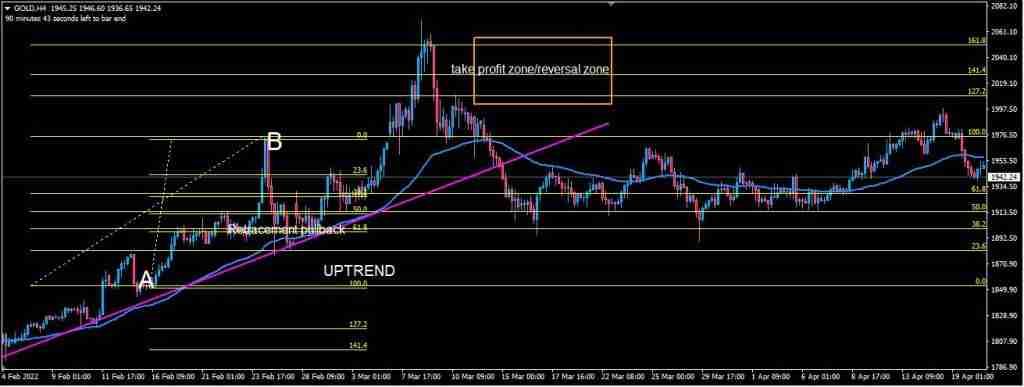
In this article, my focus will be on the Fibonacci scalping strategy since the Fibonacci tool works in all timeframes, and traders can apply it in scalping as well.
In my years of trading, I’ve discovered that the Fibonacci technique, when utilized appropriately, is really useful. Let me give you a quick description of how a Fibonacci tool works in forex in case you don’t know.
In a trending market, a Fibonacci tool can be used to identify potential retracement and reversal zones.
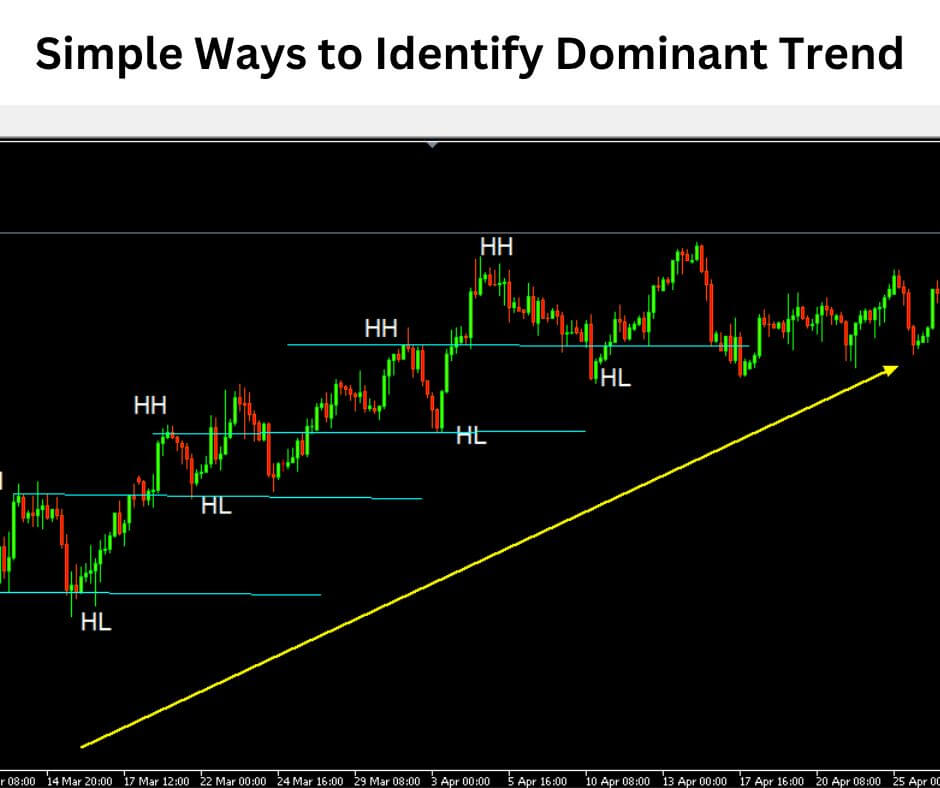
The Fibonacci tool can be used on any timeframe, but it is best to use it on a higher timeframe to filter out the noise and get a clearer perspective of the dominant trend.

WHAT IS FIBONACCI RETRACEMENT
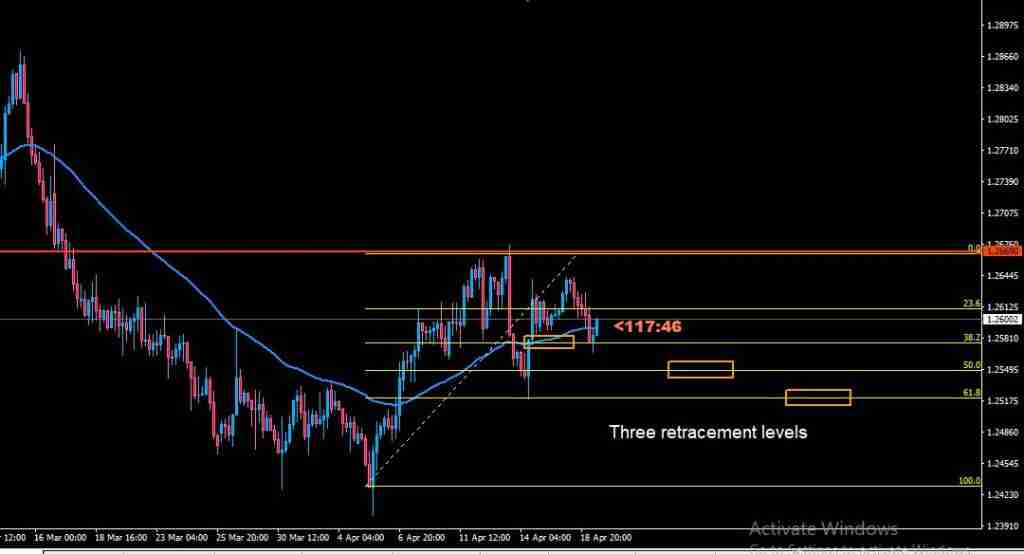
Fibonacci retracement is a popular technical analysis tool that uses percentages and horizontal lines to identify potential zones of support and resistance on price charts.
Traders can use this information to assist them in deciding when to open and close positions.
The Fibonacci tool also pinpoints zones of possible market reversal where traders can take profit and it can be used on any timeframe, however, it is preferable at higher timeframes.
RELATED: FIBONACCI EXTENSION LEVELS MT4
RELATED: 5 MINUTE SCALPING STRATEGY
RELATED: BEST 1 HOUR TRADING STRATEGY
FIBONACCI TRADING STRATEGY
The Fibonacci trading strategy has two applications: entry and exit. In this article, I’ll go through how to apply the Fibonacci trading method for entry and exit in detail.
- Fibonacci trading strategy for entry
The Fibonacci tool is used to pinpoint possible market entry after a market trend (mostly on a higher timeframe) when the market retraces to these levels which I have already mentioned above, traders look for an entry based on their strategy. (On a lower timeframe)
This entry could be a chart pattern, trend line/horizontal confluence, an engulfing candlestick, etc.
- Fibonacci Trading Strategy for Exit
The Fibonacci extension tool is used to pinpoint prospective market reversal zones as an exit strategy. These price target zones, which will be taking profit zones, are frequently found near the market’s previous highs or lows.
The majority of traders use levels 127.2, 141.4, and 161.8 as exit zones.
RELATED: FIBONACCI RETRACEMENT LEVELS ABOVE 100
FIBONACCI SCALPING STRATEGY
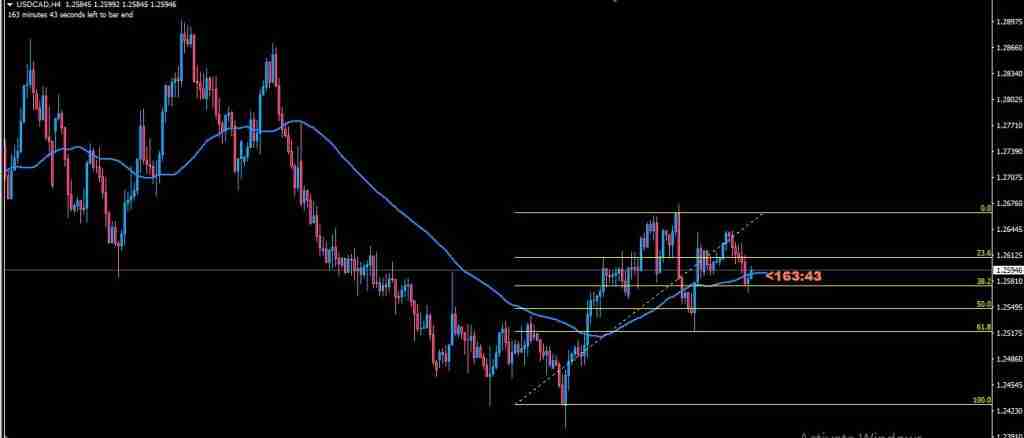
I am going to list examples of Fibonacci scalping strategy with EMA settings period: 55, shift 5 on USDCAD
Fibonacci scalping strategy USDCAD:
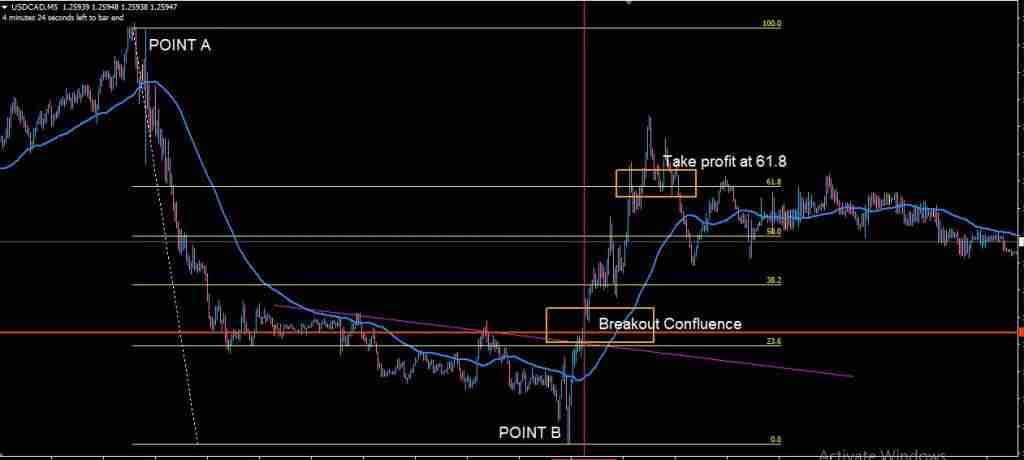
Here you see the market-dominant trend on H4 and a retracement to level 61.8 then go to your smaller timeframe for entry 15min/5min
At this point, you will be looking for a confluence where the candle closes above the trend line, the horizontal line, and the EMA.
Since scalping is a short-term market, to take your profit use the 15-minute chart to draw another fib from A(the previous high) to B (the previous low) your take profit will be at 61.8 on the 15-minute chart.
Stop loss will be below the previous low on the 5/15min chart. No need to wait for a retest.
See the Images below:

FIBONACCI RETRACEMENT SCALPING
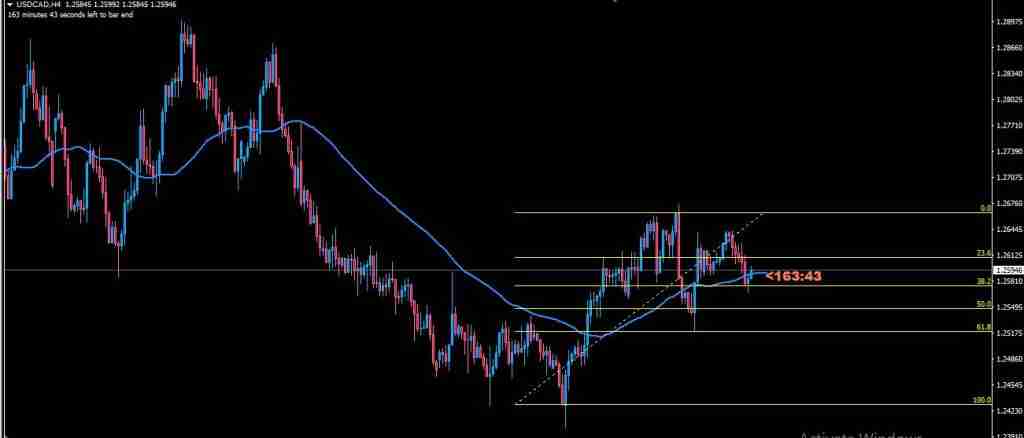
There must have been a market movement, either up or down, for a Fibonacci retracement to occur.
Price retraces after the market impulse, finding support or resistance at a retracement level of 38.2, 50, or 61.8. Your Fibonacci retracement scalping begins at this retracement level.
To start scalping, the market price must reach one of these retracement levels mentioned above.
When it reaches this point, you can start scalping based on the dominant trend.
Note that at this retracement level, you can apply candlestick engulfing, chart pattern trading, and trendline/horizontal line confluence on the lower timeframe.
See the image below:
FIBONACCI AND RSI STRATEGY
As a forex trader by now, you should know that using the Fibonacci tool for market analysis is inevitable. It has proven to be very useful across all time frames.
However, professional traders use it more on higher timeframes.
As a trader who uses the Fibonacci tool, one challenge you will encounter is to know the retracement level a market will get to before it resumes its dominant trend; this is what this article is about.
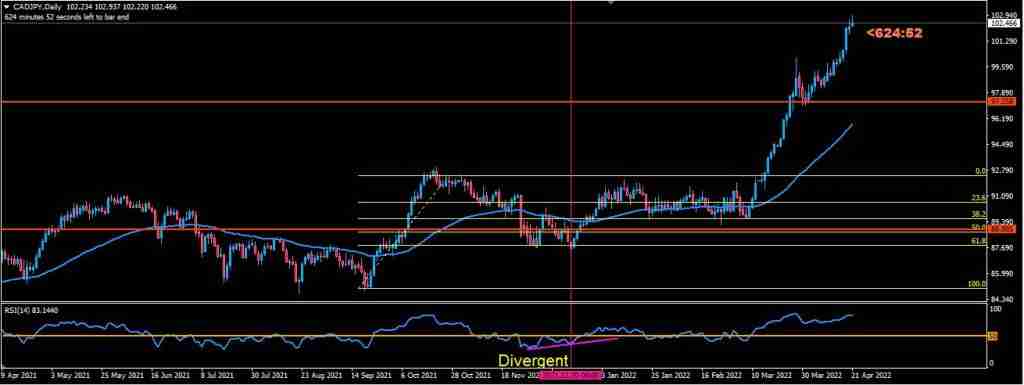
To know that market retracement has reached its limit we are going to add the RSI to the default settings.
After drawing your Fibonacci with your retracement levels in place; the next will be to look for a divergent on your RSI anytime the price reaches a retracement zone. Don’t worry I got you on this.
Above is an image view with a perfect divergence on the RSI.
The CADJPY chart Shows a divergent RSI on a bullish trend with a Fibonacci retracement of 61.8.
RELATED: SCALPING VS DAY TRADING
FIBONACCI DAY TRADING STRATEGY
Using Fibonacci for day trading is the application of the Fibonacci tool to pinpoint possible areas for trading opportunities for short-term profit.
These high-alert trading points are highlighted by the Fibonacci tool and in most cases concise with support and resistance zones.
Traders who combine Fibonacci and day trading do not stay overnight on the market.
Note that to have a successful Fibonacci day trading strategy; a trader must first draw their Fibonacci on a higher timeframe.
FIBONACCI TAKE PROFIT LEVELS
Fibonacci take-profit levels are also reversal zones, as I’ve learned over the years of trading.
Fibonacci take profit levels and reversal zones go hand in hand since the zones correspond to the previous highs and lows.
Many traders use these levels to exit a trade, especially if the trend has been lengthy. When a trade setup is identified, many traders know when to place a trade entry but they struggle with the best time to take profit on a winning trade.
To put it another way, they don’t know when to exit a profitable deal.
When it comes to exiting a trade, you don’t want to be too early or too late.
This is when the Fibonacci tool comes into play, assisting you in determining prospective take-profit levels (reversal zones).
127.2, 141.4, and 161.8 are the Fibonacci take profit levels, which are reversal zones.
Below is a chart showing Fibonacci take profit levels.
