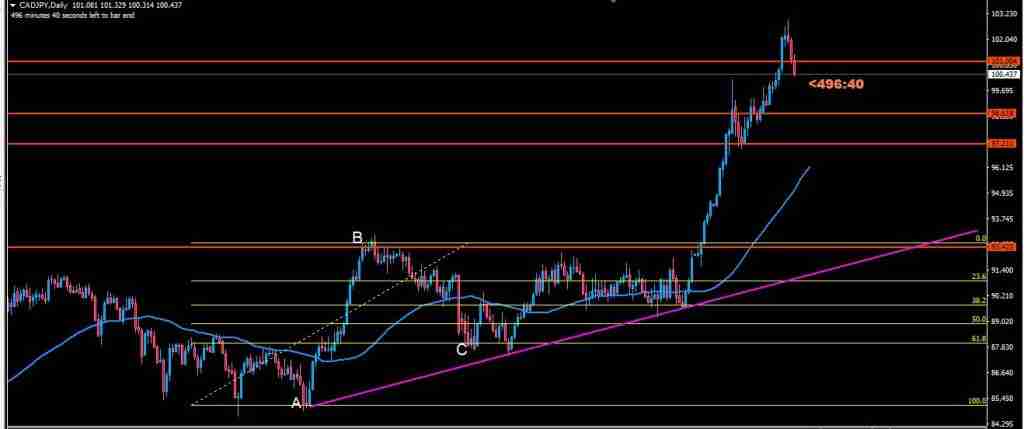
I am writing this article to help you figure out the best time for Fibonacci retracement.
Nobody educated me about forex tools like Fibonacci when I first started trading the forex market; it took years of trial and error with fancy indicators that didn’t work.
When I started paying attention to what matters, everything changed. I went to learn how to trade on the naked chart and how to use forex tools such as the trendline, horizontal line, and, of course, the Fibonacci tool.
The following few sentences will provide useful knowledge about Fibonacci and pullback timing. Join me on this exciting journey.

HOW TO DRAW FIBONACCI RETRACEMENT
Many traders miss out on a market trend pullback and continuation because they do not know how to properly draw with the Fibonacci tool.
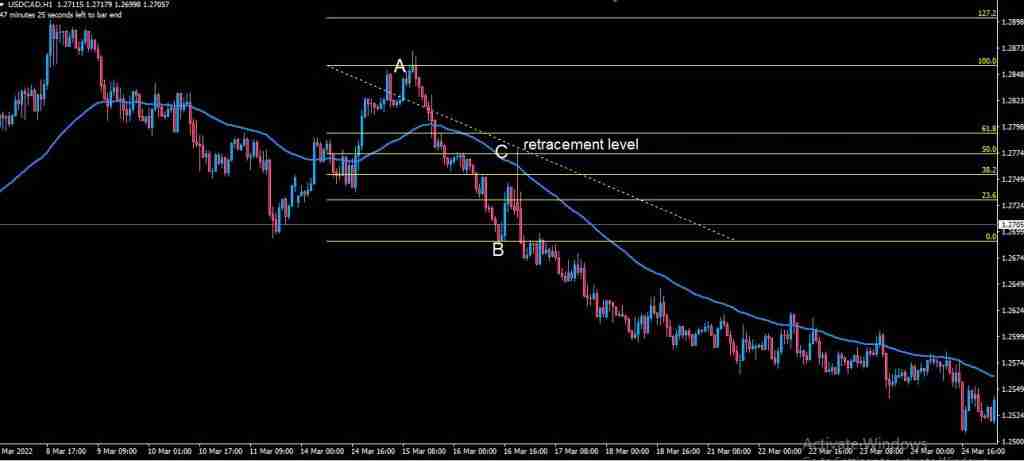
To properly identify Fibonacci retracement levels you must know the point where the market impulse begins and where it ends before you can find potential retracement levels. In other words, the impulse starts at point A, finishes at point B, and then retraces to point C.
This is how to draw Fibonacci retracement.
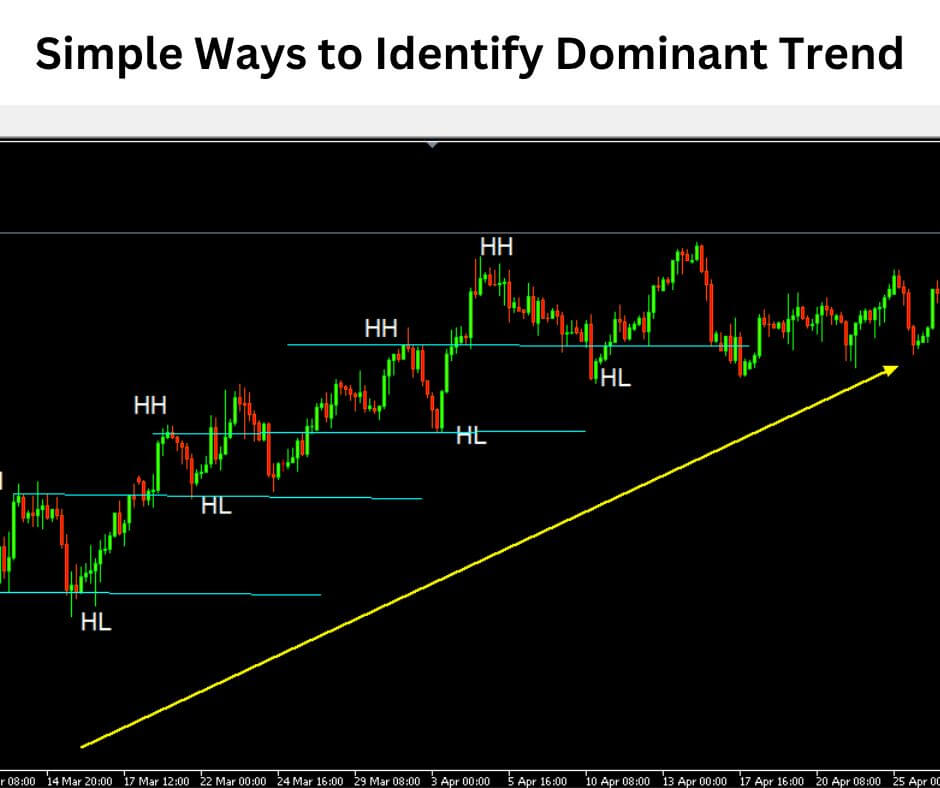
In a bullish trend:
- Draw from market impulse point A to where the market stops and retraces which is point B
- After drawing from point A to B, the fib tool will automatically pinpoint the retracement levels which will be point C
- The market can continue its dominant trend on any of the three retracement levels; this is why I call them potential retracement levels.
- Repeat the same process for a bearish trend
Before I show you a pictorial view of Fibonacci retracement, know that there are three retracement levels
38.2, 50 and 61.8
Note that 38.2 retracement levels indicate a stronger continuation move than the 50 and 61.8 levels.
Below is an image of how to draw Fibonacci retracement:
BEST TIME FOR FIBONACCI RETRACEMENT
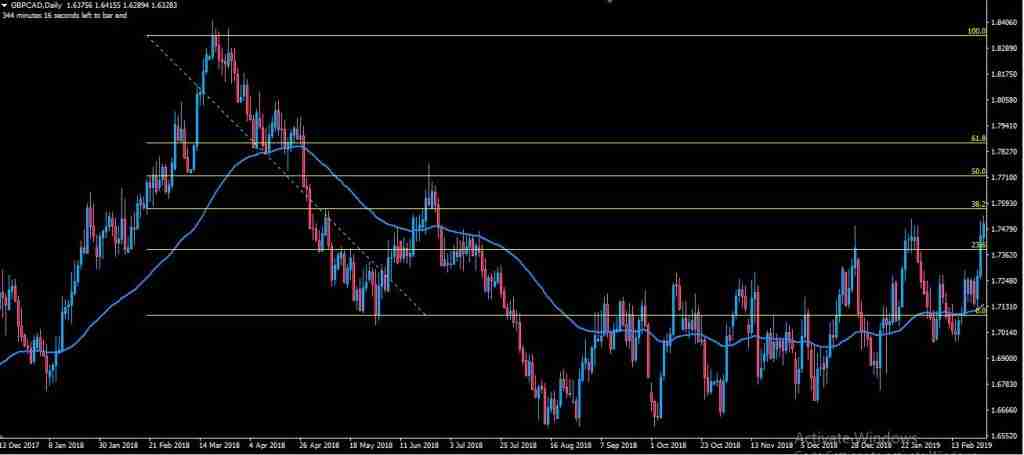
The best time for Fibonacci retracement is after a significant market move in either direction.
After the end of the move, the Fibonacci is drawn from the beginning (A) to the end (B) of the move.
After the fib has been drawn, you will find that your Fibonacci retracement level will align at a resistant or support level.
RELATED: FIBONACCI SCALPING STRATEGY
FIBONACCI RETRACEMENT VS EXTENSION
In using the Fibonacci tool, Fibonacci retracement and extension go hand in hand. Fibonacci retracement is simply the measurement of how far a pull would go before trend continuation while the Fibonacci extension is how far a trend would go after retracement.
Fibonacci retracement and extension often align with previous highs and lows or major zones of support and resistance.
The Fibonacci extension can also pinpoint market reversal zones after a long market trend.
HOW TO USE FIBONACCI RETRACEMENT WITH SUPPORT AND RESISTANCE
A good Fibonacci strategy is to combine with other trading methods like adding support and resistance when using the Fibonacci tool.
First of all, the market moves in structures, you will see these structures in support and resistance, chart patterns, previous highs, and lows.
That being said, this is how to use Fibonacci retracement with support and resistance.
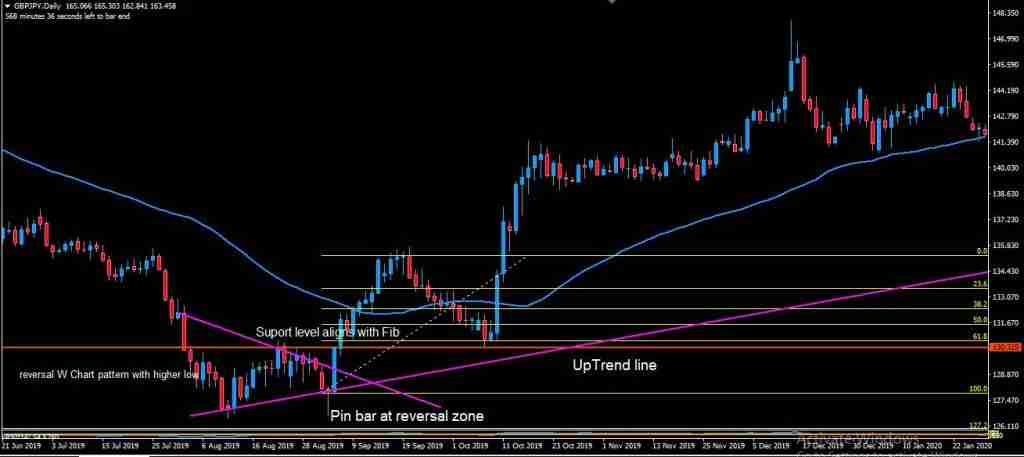
As a trader when these structures are being formed, do well to mark them so that when a market impulse happens, on the retracement you will be able to see how the Fibonacci tool, when drawn aligns with the support and resistance levels previously marked out.
The combination of the Fibonacci tool with support and resistance levels gives better trade setups.
See the image below:
FIBONACCI RETRACEMENT SETTINGS
Traders should be aware of three retracement levels in the Fibonacci tool. The settings must be imputed correctly for these levels to appear on the Fibonacci tool.
See the Fibonacci retracement settings below.
| LEVEL | DESCRIPTION |
| 0.382 | 38.2 |
| 0.5 | 50.0 |
| 0.618 | 61.8 |
The above is the best Fibonacci retracement levels/settings.
HOW TO DRAW FIBONACCI RETRACEMENT IN UPTREND
To properly draw a Fibonacci retracement in an uptrend, there has to first be an obvious market impulse in a bullish direction.
The Fibonacci tool is drawn from point A (where market momentum starts) to point B (where the momentum stops and starts a pullback) and then point C (retracement levels).
As it is been drawn the Fibonacci retracement levels are automatically placed.
See the image below:
