Every forex trader knows that moment when you’re staring at your charts, wondering if you’ve picked the right moving average settings.
You’ve probably tried dozens of combinations, only to watch your trades move against you whilst the market seems to mock your technical analysis.
The truth is, most traders approach moving averages backwards they focus on the indicator first, then the market second.
Here’s what successful traders understand: the best moving average for 4 hour chart isn’t just about finding magical numbers.
It’s about understanding how these lagging indicators work within the broader context of market structure.
The 4 hour timeframe offers the perfect balance between capturing significant price movements and filtering out the noise that plagues shorter timeframes.
But here’s the thing that might surprise you about moving averages on H4 charts.
- WHY THE 4 HOUR CHART IS PERFECT FOR MOVING AVERAGES
- THE SCIENCE BEHIND MOVING AVERAGE SELECTION
- BEST MOVING AVERAGE FOR 4 HOUR CHART COMBINATIONS
- BEST MA STRATEGY FOR TRADING H4 TIMEFRAME IN FOREX
- MOVING AVERAGES ACROSS DIFFERENT TIMEFRAMES
- THE BEST MOVING AVERAGE CROSSOVER STRATEGY
- COMMON MOVING AVERAGE MISTAKES TO AVOID
- OPTIMISING MOVING AVERAGE PERFORMANCE
- WHEN MOVING AVERAGES FAIL
- PLATFORM SPECIFIC CONSIDERATIONS
- ADVANCED MOVING AVERAGE TECHNIQUES
- PSYCHOLOGICAL ASPECTS OF MOVING AVERAGE TRADING
- BUILDING YOUR MOVING AVERAGE TRADING PLAN
- THE FUTURE OF MOVING AVERAGE TRADING
- PRACTICAL IMPLEMENTATION GUIDE
- CONCLUSION
WHY THE 4 HOUR CHART IS PERFECT FOR MOVING AVERAGES
The 4 hour timeframe sits in the sweet spot of forex trading. It’s long enough to filter out random market noise, yet short enough to capture meaningful price movements throughout the trading day.
When you combine this with the right moving average settings, you create a powerful framework for identifying trends and potential entry points.
Unlike shorter timeframes that can whipsaw you into losses, the H4 chart gives moving averages room to breathe.
This means fewer false signals and more reliable trend identification. The slower pace also allows you to make more considered decisions rather than rushing into trades based on every minor price fluctuation.
THE SCIENCE BEHIND MOVING AVERAGE SELECTION
Are moving averages reliable for trading since they lag? This is perhaps the most common question among forex traders, and the answer isn’t straightforward.
Yes, moving averages are lagging indicators by nature they’re based on historical price data. However, this “lag” isn’t necessarily a weakness when used correctly.
The key lies in understanding that moving averages don’t predict future price movements; they confirm existing trends.
This confirmation bias can actually work in your favour when combined with proper market structure analysis.
The lag becomes less of an issue on higher timeframes like H4, where the trend changes are more significant and sustained.

BEST MOVING AVERAGE FOR 4 HOUR CHART COMBINATIONS

Primary Combinations That Work;
1. MA 34 and MA 50 Combination
- Fast MA: 34-period simple moving average
- Slow MA: 50-period simple moving average
- Best for: Trend following and crossover signals
- Why it works: The 34 and 50 periods provide enough separation to avoid constant crossovers whilst remaining sensitive to trend changes
2. EMA 200 and EMA 50 Combination
- Fast EMA: 50-period exponential moving average
- Slow EMA: 200-period exponential moving average
- Best for: Long-term trend identification and major support/resistance levels
- Why it works: The 200 EMA acts as a dynamic support/resistance level, whilst the 50 EMA provides more timely signals
3. Triple EMA System (Advanced)
- EMA 21 (shift 1)
- EMA 55 (shift 5)
- EMA 89 (shift 8)
- Additional: EMA 233 (shift 3) – calculated three times for high, median, and low
- Best for: Experienced traders who understand market structure
- Why it works: The shifted EMAs help reduce false signals by accounting for market volatility
Understanding EMA Shifts
The “shift” parameter moves the moving average forward or backward in time. For example, EMA 21 (shift 1) plots the 21-period EMA one candle ahead.
This technique can help reduce some of the lag inherent in moving averages, but it requires careful backtesting to ensure effectiveness.

BEST MA STRATEGY FOR TRADING H4 TIMEFRAME IN FOREX
The Foundation: Market Structure First
Before diving into moving average strategies, you need good knowledge of the market structure. This means understanding:
- Support and resistance levels
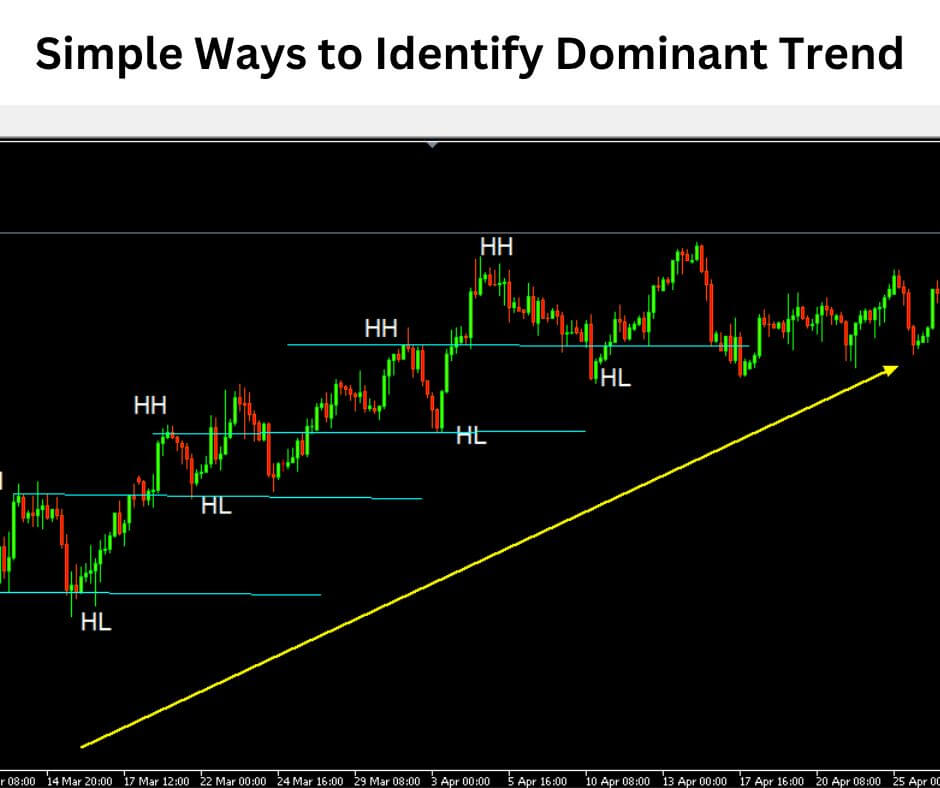
- Trend identification
- Key reversal patterns
- Market sentiment shifts
Without this foundation, even the best moving average settings will fail you.
Strategy 1: The Trend Continuation Approach
Setup Requirements:
- Identify the dominant trend on daily or weekly charts
- Wait for price to pull back to your chosen moving average on H4
- Look for confirmation signals (candlestick patterns, momentum indicators)
- Enter in the direction of the dominant trend
Moving Average Settings:
- Primary: EMA 50
- Secondary: EMA 200 for trend confirmation
Entry Rules:
- Price touches EMA 50 in trending market
- Candlestick confirmation at the moving average
- Stop loss below/above the moving average
- Target based on next significant support/resistance level
Strategy 2: The Crossover Method
Setup Requirements:
- Use dual moving average system (EMA 34 and EMA 50)
- Wait for crossover in direction of higher timeframe trend
- Confirm with volume and momentum indicators
Entry Rules:
- Fast EMA crosses above slow EMA (bullish signal)
- Fast EMA crosses below slow EMA (bearish signal)
- Enter on the close of the crossover candle
- Setting stop loss and take profit in MT4 becomes crucial here place stops beyond the slow moving average
Strategy 3: The Support/Resistance Bounce
Setup Requirements:
- Identify key support/resistance levels
- Use EMA 200 as dynamic support/resistance
- Look for price reactions at these levels
Entry Rules:
- Price approaches EMA 200 level
- Candlestick reversal pattern forms
- Volume confirms the reversal
- Enter with tight stop loss
MOVING AVERAGES ACROSS DIFFERENT TIMEFRAMES
1-Hour Chart Settings
The H1 timeframe works excellently with the same moving average settings used on H4. The key difference is that signals will be more frequent but potentially less reliable. Use H1 for:
- Fine-tuning H4 entries
- Scalping in trending markets
- Managing existing H4 positions
Daily Chart Settings
For daily charts, the EMA 233 (shift 3) becomes particularly powerful. This longer-term moving average helps identify:
- Major trend changes
- Long-term support/resistance levels
- Portfolio-level trend direction
15-Minute Chart Applications
The 15-minute timeframe should primarily be used for entry refinement after H4 analysis. The EMA 21 (shift 1) works well for:
- Precise entry timing
- Intraday scalping opportunities
- Managing short-term position adjustments
THE BEST MOVING AVERAGE CROSSOVER STRATEGY

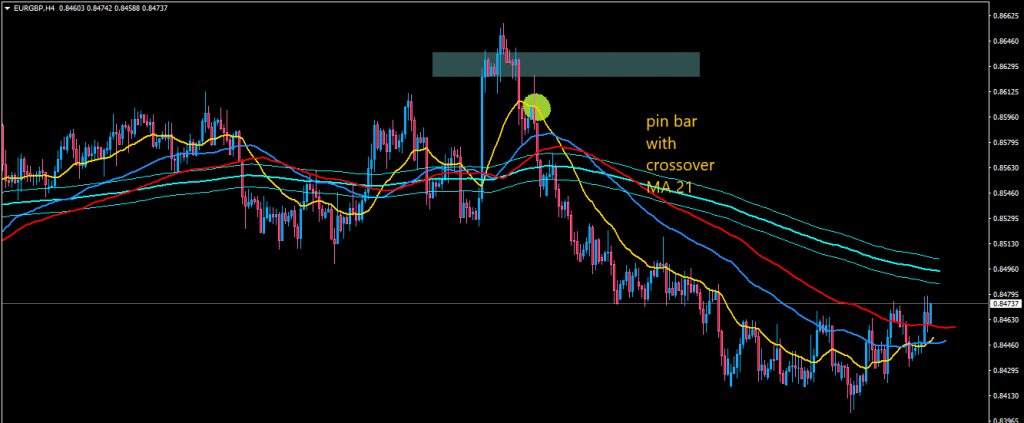
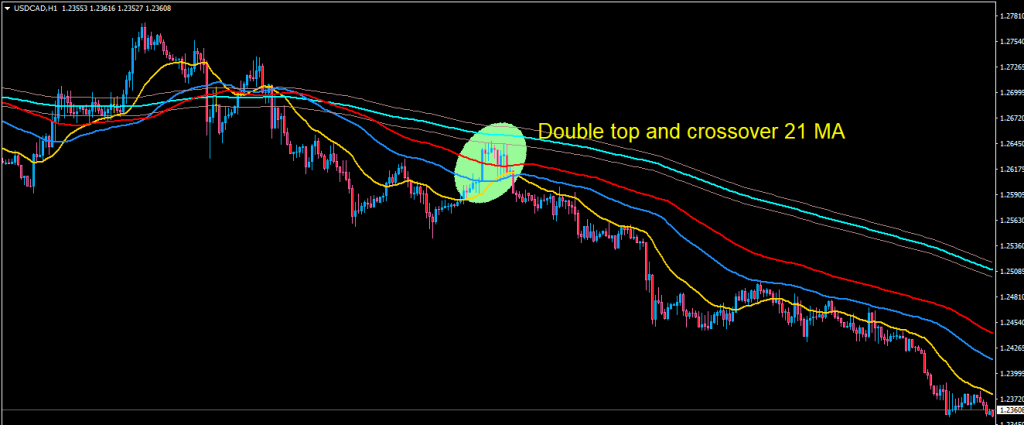
The most effective crossover strategy combines the EMA 233 (shift 3) with proper market structure analysis. Here’s how it works:
Pre-Crossover Analysis:
- Identify support/resistance breakout on higher timeframe
- Wait for retest of the broken level
- Look for crossover confirmation
Crossover Execution:
- EMA 233 (shift 3) calculated for high, median, and low
- Wait for all three calculations to align
- Enter when price confirms the crossover direction
This very easy and profitable trading strategy on MT4 becomes powerful when combined with proper risk management and market structure understanding.
COMMON MOVING AVERAGE MISTAKES TO AVOID
Over-Reliance on Indicators
The biggest mistake traders make is treating moving averages as crystal balls. They’re tools for confirmation, not prediction. Always combine them with:
- Price action analysis
- Market structure understanding
- Fundamental analysis where relevant
Ignoring Market Context
Moving averages work differently in:
- Trending markets: Excellent for trend following
- Range-bound markets: Frequent false signals
- High volatility periods: Increased whipsaws
Wrong Timeframe Selection
Using moving averages on timeframes that don’t match your trading style leads to:
- Overtrading on lower timeframes
- Missing opportunities on higher timeframes
- Inconsistent results
OPTIMISING MOVING AVERAGE PERFORMANCE
Combine with Other Indicators
Momentum Indicators:
- RSI for overbought/oversold conditions
- MACD for trend confirmation
- Stochastic for timing entries
Volume Indicators:
- Volume confirmation for breakouts
- On-balance volume for trend strength
Risk Management Integration
Position Sizing:
- Adjust position size based on distance to moving average
- Larger positions when price is near MA support/resistance
- Smaller positions during uncertain periods
Stop Loss Placement:
- Beyond significant moving averages
- Account for normal market volatility
- Adjust based on how much you can make trading Forex per calculations
WHEN MOVING AVERAGES FAIL
Recognising Market Regime Changes
How to know when a trend is ending becomes crucial for moving average traders. Watch for:
- Multiple false breakouts
- Decreasing momentum despite continued trend
- Fundamental shifts in market sentiment
- Unusual volume patterns
Adapting to Market Conditions
Choppy Markets:
- Reduce position sizes
- Tighten stops
- Consider staying flat
Trending Markets:
- Increase position sizes
- Trail stops using moving averages
- Add to winning positions
PLATFORM SPECIFIC CONSIDERATIONS
MetaTrader 4 and 5 Implementation
For traders using MetaTrader 5 brokers platforms, moving average implementation is straightforward:
MT4/MT5 Advantages:
- Built-in moving average indicators
- Easy customisation of periods and shifts
- Automated trading capabilities
- Backtesting functionality
Custom Indicators:
- Enhanced moving average variants
- Multi-timeframe displays
- Alert systems for crossovers
ADVANCED MOVING AVERAGE TECHNIQUES
Adaptive Moving Averages
These adjust their sensitivity based on market volatility:
- Kaufman’s Adaptive Moving Average (KAMA)
- Variable Index Dynamic Average (VIDYA)
- Fractal Adaptive Moving Average (FRAMA)
Multiple Timeframe Analysis
Top-Down Approach:
- Weekly/Daily for trend direction
- H4 for entry timing
- H1 for precise execution
Confluence Levels:
- Multiple timeframe MA alignment
- Stronger signal reliability
- Higher probability setups
PSYCHOLOGICAL ASPECTS OF MOVING AVERAGE TRADING
Patience and Discipline
Moving average trading requires:
- Waiting for proper setups
- Accepting occasional losses
- Maintaining discipline during drawdowns
Managing Expectations
Realistic Expectations:
- 50-60% win rate is excellent
- Focus on risk-reward ratios
- Compound gains over time
Avoiding Perfectionism:
- No system wins 100% of the time
- Accept that some trades will lose
- Focus on overall profitability
BUILDING YOUR MOVING AVERAGE TRADING PLAN
Step 1: Define Your Trading Style
Swing Trading:
- H4 and daily charts
- Longer-term moving averages
- Wider stop losses
Day Trading:
- H1 and H4 charts
- Shorter-term moving averages
- Tighter risk management
Step 2: Backtest Your Strategy
Testing Requirements:
- Minimum 100 trades
- Various market conditions
- Different currency pairs
- Multiple timeframes
Step 3: Forward Testing
Demo Trading:
- Live market conditions
- Real-time execution
- Emotional discipline practice
- Strategy refinement
THE FUTURE OF MOVING AVERAGE TRADING
Algorithmic Integration
Modern trading increasingly involves:
- Automated moving average systems
- Machine learning enhancements
- High-frequency applications
- Improved signal filtering
Market Evolution
Changing Market Dynamics:
- Increased algorithmic trading
- Faster information flow
- Different volatility patterns
- Adapted strategies needed
PRACTICAL IMPLEMENTATION GUIDE
Setting Up Your Charts
Essential Elements:
- Clean chart layout
- Appropriate moving averages
- Support/resistance levels
- Volume indicators
Recommended Colour Scheme:
- Fast MA: Blue or green
- Slow MA: Red or orange
- Price: Candlestick format
- Background: Dark theme for eye comfort
Daily Routine
Morning Analysis:
- Check higher timeframe trends
- Identify key levels
- Plan potential setups
- Set alerts for entry points
Execution Phase:
- Wait for setups
- Confirm with multiple factors
- Execute with proper risk management
- Document trades for review
CONCLUSION
The best moving average for 4 hour chart trading isn’t about finding magical settings that work in all market conditions.
It’s about understanding how these tools fit within a comprehensive trading framework that includes market structure analysis, proper risk management, and psychological discipline.
The combinations we’ve discussed MA 34/50, EMA 50/200, and the advanced triple EMA system—have proven effective across various market conditions.
However, their success depends entirely on your ability to interpret market context and apply them consistently.
Remember, moving averages are confirming indicators, not crystal balls. They work best when combined with sound market structure analysis and proper risk management.
The lag that many traders complain about becomes less relevant when you understand that you’re looking for confirmation of existing trends, not prediction of future ones.
Your next step: Choose one moving average combination from this guide and spend the next month backtesting it on your preferred currency pairs.
Focus on understanding how it behaves in different market conditions rather than hunting for the perfect win rate.
Ready to take your trading to the next level? Start implementing these moving average strategies today, but remember the indicator is only as good as the trader using it. Master the basics, understand market structure, and maintain discipline in your approach.
The markets are waiting. Your moving averages are ready. Now it’s time to put knowledge into action.


