Just like every other trading instrument, to know how to trade Volatility 100 index you must understand how it moves across all the timeframes paying attention to high trigger zones especially swing highs and lows.
The Volatility 100 Index is a captivating arena in the ever-evolving financial markets, offering traders high-octane opportunities that demand specialized strategies and a keen understanding of market dynamics.
With its reputation for rapid and unpredictable price swings, trading this index requires tailored tactics that capitalize on volatility’s potential for substantial gains.
This comprehensive guide equips both new and seasoned traders with insights into navigating the intricacies of the Volatility 100 Index.
We will explore proven strategies, risk mitigation techniques, and expert perspectives to empower you to seize opportunities while managing inherent volatility.
Volatility 100 index is one of the most volatile indices designed by Deriv, its volatility, and liquidity allow synthetic traders across all the time frames to profit from its movement.
Embark on this journey to unravel the art of trading the Volatility 100 Index and unlock its potential for enhancing your trading endeavors.
- HOW TO TRADE VOLATILITY 100 INDEX
- VOLATILITY 100 INDEX SIGNALS
- VOLATILITY 100 INDEX LIVE CHART
- VOLATILITY 100 INDEX STRATEGY
- BEST TIME TO TRADE VOLATILITY 100 INDEX
- WHAT IS THE VOLATILITY 100 (1S) INDEX
- VOLATILITY INDEX TRADING STRATEGIES
- HOW TO TRADE VOLATILITY INDEX 75
- WHAT IS VOLATILITY 100 INDEX IN FOREX?
- HOW DO YOU TRADE A VOLATILITY INDEX?
- CONCLUSION
HOW TO TRADE VOLATILITY 100 INDEX
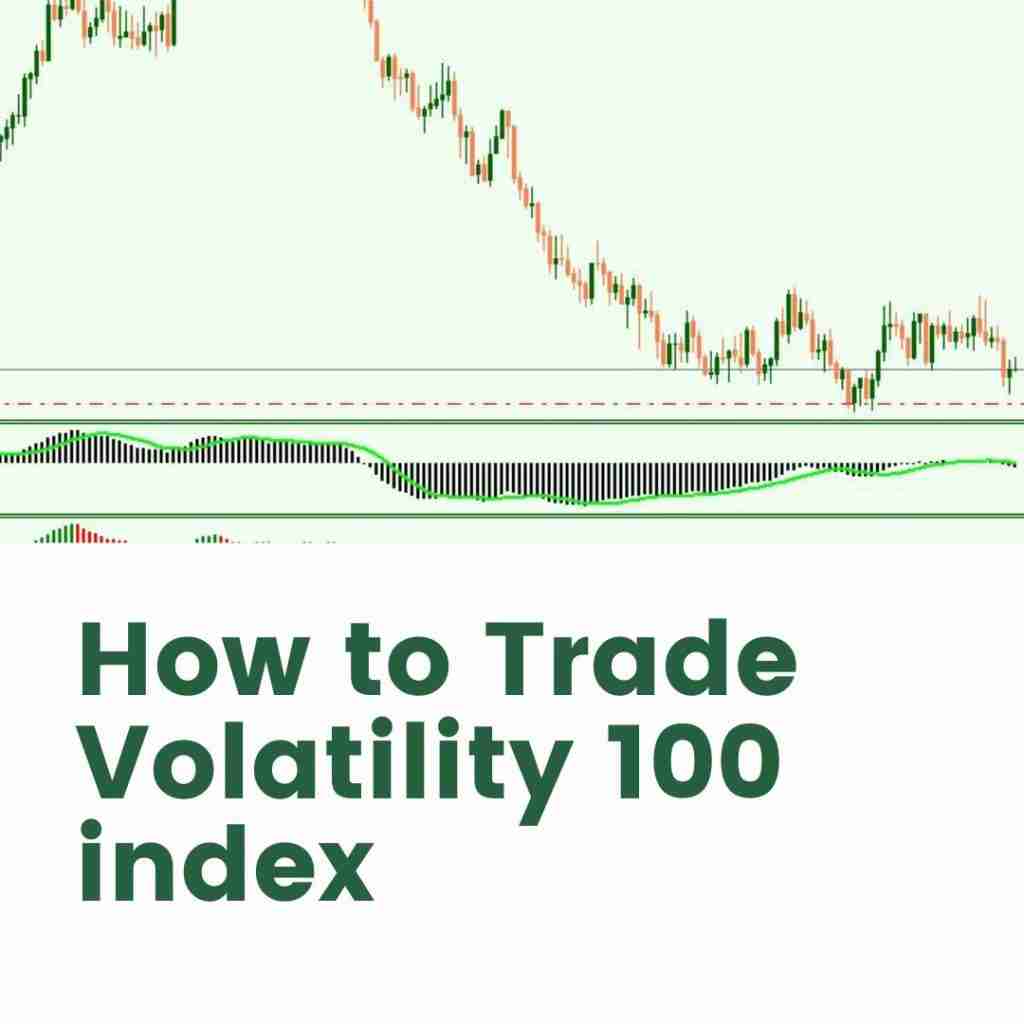
This is how to trade Volatility 100 index:
- Identify the dominant trend
- Wait for pullback or retracement
- Join in the trend when see a chart pattern example bullish flag
- You can join in trend continuation on a lower timeframe.

VOLATILITY 100 INDEX SIGNALS
Many synthetic traders keep looking for the best volatility 100 signals and they forget to pay attention to what is before them.
In the MT4/MT5 platform, you will find all the needed tools you would need for trading. These tools include trend lines, horizontal lines, Fibonacci, and more.
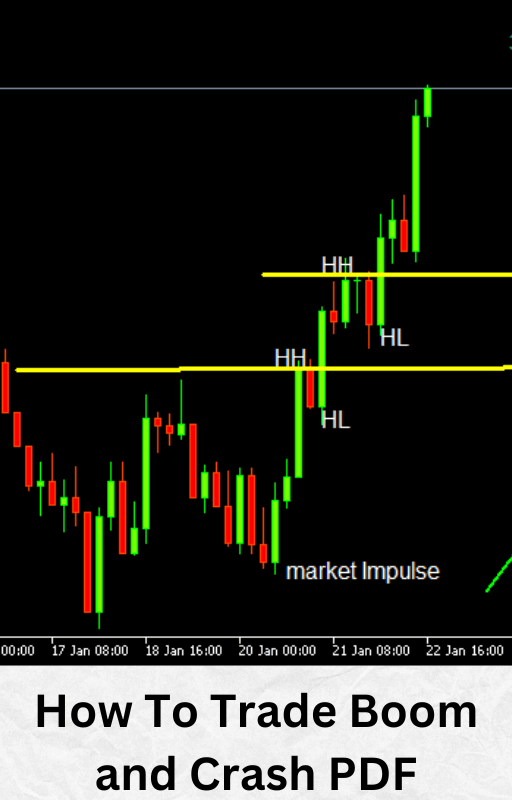
For the record, before you go to find a volatility 100 index signal group you should first learn market structure.
VOLATILITY 100 INDEX LIVE CHART
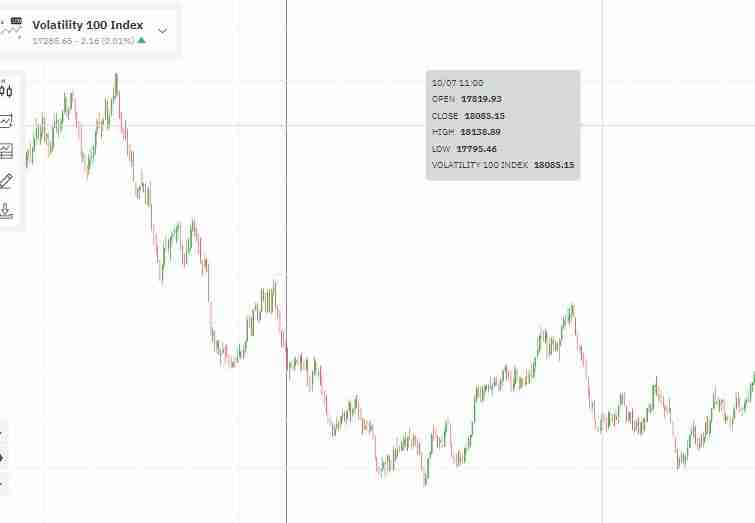
Volatility 100 index live chart shows the price movement of V100 indices, it also comes with all the tools on MT5. It comes with multiple timeframes from 1 minute to Monthly.
VOLATILITY 100 INDEX STRATEGY
If you have been trading synthetic indices on Deriv, you would know that the Volatility 100 index is one volatile instrument.
Because of its volatility, I would recommend that it should be traded on a lower time frame to reduce risk and maximize profit.
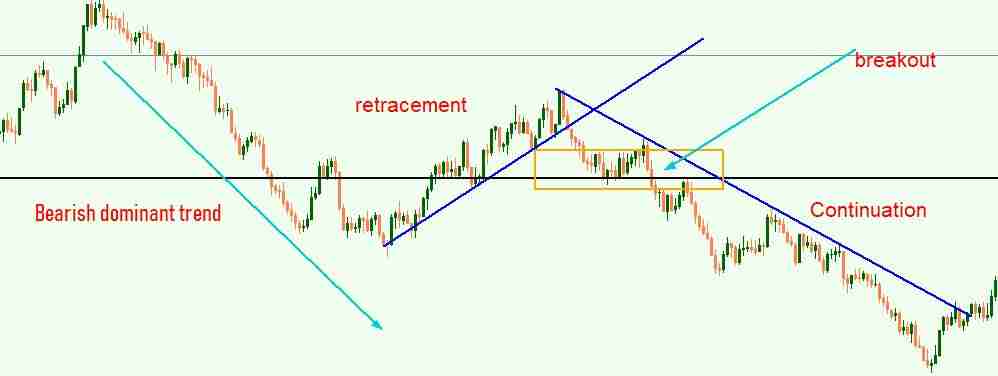
Volatility 100 index strategy entails following the market’s dominant trend and chart patterns.
This is how to trade the Volatility 100 index
- Identify the dominant trend
- Wait for pullback
- Join the dominant trend from a lower timeframe.
See the image below:

BEST TIME TO TRADE VOLATILITY 100 INDEX
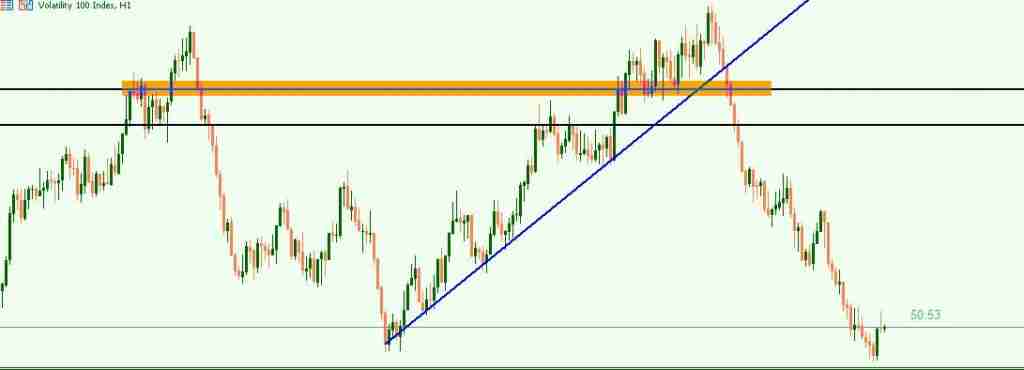
The best time to trade the Volatility 100 index is after a break in market structure on the lower timeframe. The reason is that the V100 index is volatile and fast.
Trading on a higher time frame will require a large capital but with a lower timeframe, you can manage the risk.
Note that you will have to zoom out your chart to see a well-formed structure before you can make any trading decision.
Here are some MT5 tools you would need to trade the Volatility 100 index
- Trend line
- Horizontal line
- Fibonacci tool
- The above tools will help you map out trigger zones for potential entry.
Below is an image example that shows a break in structure:
WHAT IS THE VOLATILITY 100 (1S) INDEX
The volatility 100(1s) index is a synthetic index designed by Deriv to simulate real-world market movement.
These indices, which are powered by a cryptographically secure random number generator, are open for trading 24 hours a day, seven days a week, and are unaffected by traditional market hours, global events, or market and liquidity difficulties.
For the volatility 100, one tick is generated per second (1s).
VOLATILITY INDEX TRADING STRATEGIES
What is important in trading volatility index is to stay with a strategy that works. Your success in trading is not tied to multiple strategies.
Because volatility indices are synthetic and not bound to market hours and global events, it perfect for technical trading.
That being said to have a good and consistent volatility index you should focus on identifying structures when they are formed and broken.
These market structures and patterns can be seen across all the timeframes. In the MT5 platform, you will find all the tools needed to help you map out the structures easily.
Some of these tools are trend lines, horizontal lines, Fibonacci tools, and more.
These tools help you pinpoint support and resistance zones and to identify chart patterns as well.
You can read up more regarding volatility index trading.
HOW TO TRADE VOLATILITY INDEX 75
To effortlessly trade volatility index 75 you should pay attention to market structure, theses market structures don’t appear every day but when they do, the accuracy is high.
These structures can appear as a reversal pattern or a continuation pattern.
To understand this properly you should read my previous article on price action and market structure.
See the visual example below and frequently asked question regarding how to trade Volatility 100 index:
WHAT IS VOLATILITY 100 INDEX IN FOREX?
Volatility 100 index is a synthetic instrument designed and offered by Deriv broker, it is not a forex instrument.
HOW DO YOU TRADE A VOLATILITY INDEX?
You can trade volatility index with market structure.
CONCLUSION
When it comes to Volatility 100 index, market structure will always play a major role irrespective of what trading strategy you employ.