You’re watching a football match, and instead of focusing on individual players running around, you start noticing the bigger picture the formation, the flow of play, the momentum shifts.
That’s exactly what understanding market structure in Forex is like.
Market structure is the backbone of every successful trading strategy. It’s the invisible framework that determines whether prices will rise, fall, or move sideways.
Yet most traders overlook this fundamental concept, focusing instead on fancy indicators and complex systems.
Here’s the thing: when trading Forex, the market doesn’t move randomly. It follows specific patterns and structures that, once understood, can dramatically improve your trading results.
- WHAT IS MARKET STRUCTURE IN FOREX?
- CORE COMPONENTS OF MARKET STRUCTURE
- HOW TO IDENTIFY MARKET STRUCTURE IN FOREX
- MARKET STRUCTURE TRADING STRATEGY
- WHY MARKET STRUCTURE WORKS IN FOREX
- MARKET PSYCHOLOGY AND STRUCTURE
- RISK MANAGEMENT WITH MARKET STRUCTURE
- COMMON MISTAKES IN MARKET STRUCTURE ANALYSIS
- MARKET STRUCTURE ACROSS DIFFERENT SESSIONS
- ADVANCED MARKET STRUCTURE CONCEPTS
- BUILDING YOUR MARKET STRUCTURE TRADING PLAN
- CONCLUSION
WHAT IS MARKET STRUCTURE IN FOREX?

Market structure in Forex refers to the organized patterns and formations that appear on your trading charts, revealing the underlying direction and momentum of currency pairs.
Think of it as the market’s DNA the genetic code that determines how prices behave.
At its core, market structure shows you three fundamental market states:
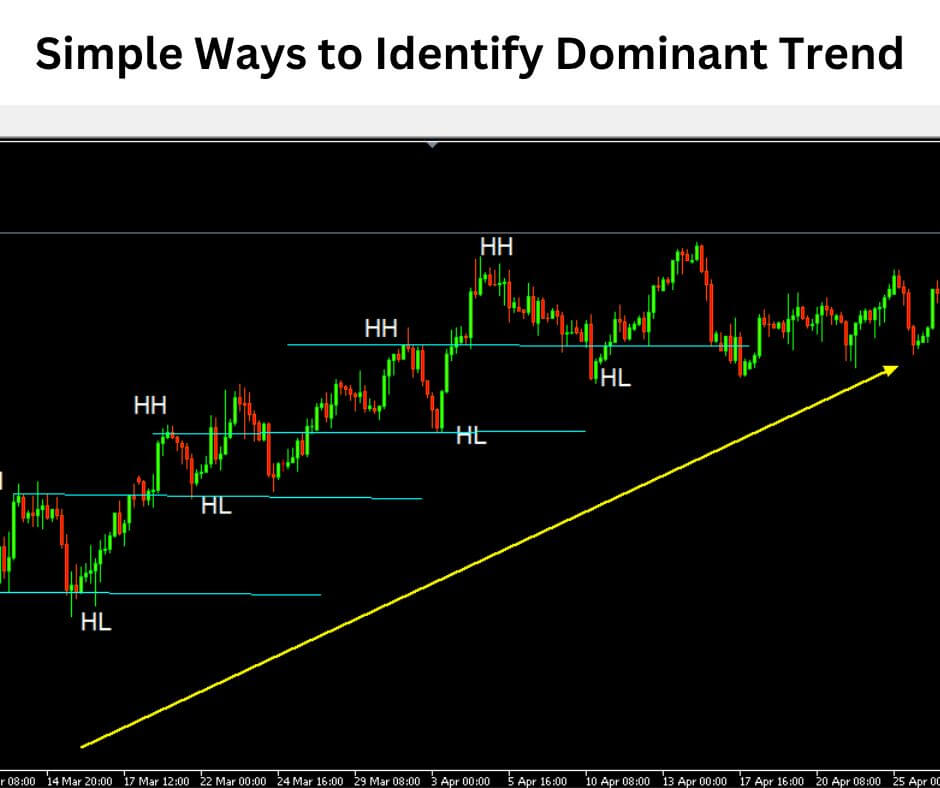
- Uptrend (Bullish): Higher highs and higher lows
- Downtrend (Bearish): Lower highs and lower lows
- Sideways (Ranging): Price oscillating between support and resistance
The beauty of market structure lies in its simplicity. Unlike indicators that lag behind price movement, market structure tells you what’s happening right now.
It’s pure price action—no noise, no delays, just raw market information.
CORE COMPONENTS OF MARKET STRUCTURE
Understanding market structure requires grasping its fundamental building blocks. Let’s break down each component:
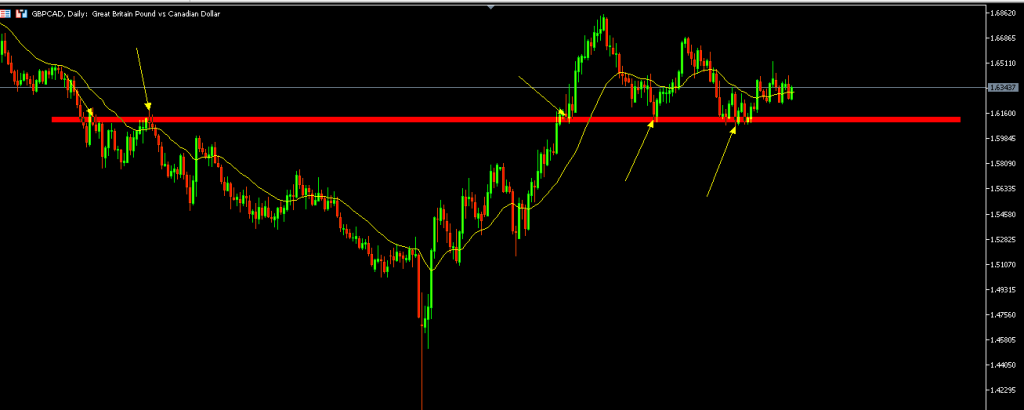
Support and Resistance Levels
Support and resistance form the foundation of market structure. Support acts like a floor where buying pressure emerges, whilst resistance serves as a ceiling where selling pressure kicks in.
Support levels occur when:
- Price consistently bounces higher from a specific level
- Buyers step in to prevent further decline
- Historical data shows multiple reactions from the same area
Resistance levels form when:
- Price repeatedly fails to break above a certain level
- Sellers emerge to push prices lower
- Multiple rejections occur from the same zone
Supply and Demand Zones
Think of supply and demand zones as the VIP areas of the market. These are regions where significant buying or selling activity has occurred, creating imbalances that affect future price movement.
Demand zones (buying zones):
- Areas where price shot up aggressively
- Strong buying interest exists
- Often coincide with support levels
Supply zones (selling zones):
- Areas where price dropped sharply
- Heavy selling pressure present
- Typically align with resistance levels
Chart Patterns
Chart patterns are the market’s way of telegraphing its next move. These formations appear repeatedly because they reflect human psychology and market behaviour.
Common bullish patterns:
- Double bottom (W pattern)
- Inverted head and shoulders
- Ascending triangles
- Bull flags and pennants
Common bearish patterns:
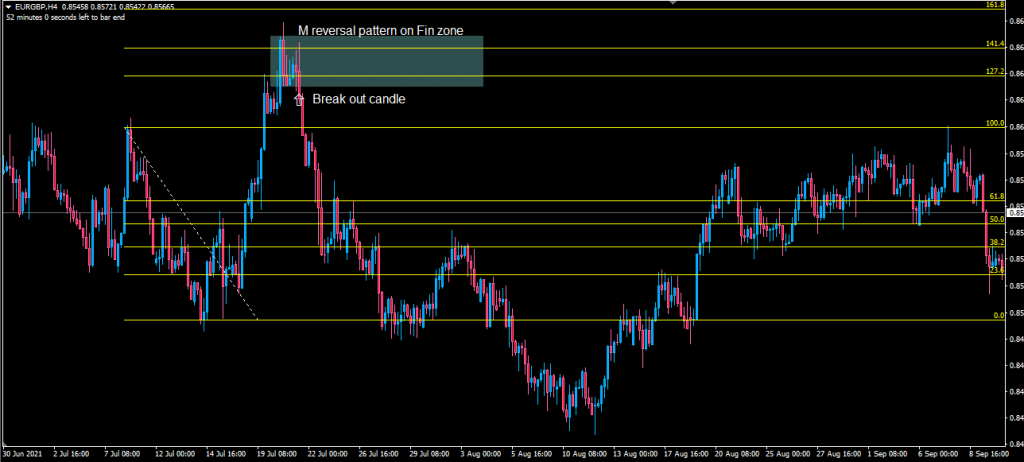
- Double top (M pattern)
- Head and shoulders
- Descending triangles
- Bear flags and pennants
HOW TO IDENTIFY MARKET STRUCTURE IN FOREX
Identifying market structure isn’t rocket science, but it does require a systematic approach. Here’s your step-by-step guide:
Step 1: Start with Higher Timeframes
The secret to understanding market structure lies in adopting a top-down approach. Start with weekly and daily charts to identify the dominant trend, then work your way down to lower timeframes.
Why higher timeframes matter:
- They filter out market noise
- Show the true direction of the trend
- Provide key levels for entry and exit
- Reveal long-term support and resistance zones
Step 2: Mark Key Levels
Using your charting tools, mark significant support and resistance levels. These levels should stand out like landmarks on your chart.
Essential tools for marking levels:
- Horizontal lines for support and resistance
- Trend lines for dynamic levels
- Rectangles for consolidation zones
- Fibonacci retracements for key levels
Step 3: Identify the Trend Direction
Once you’ve marked key levels, determine the overall trend direction. This is where understanding market structure becomes crucial for your trading success.
Uptrend characteristics:
- Series of higher highs and higher lows
- Price consistently breaking above previous highs
- Pullbacks find support at higher levels
Downtrend characteristics:
- Series of lower highs and lower lows
- Price breaking below previous lows
- Rallies face resistance at lower levels
Sideways trend characteristics:
Equal highs and lows
Price bouncing between defined support and resistance
No clear directional bias

MARKET STRUCTURE TRADING STRATEGY
Now that you understand what market structure is, let’s explore how to trade it effectively. This approach has been proven as one of the most reliable trading methods among professional traders.
The Structure-Based Entry Method
This method focuses on trading breaks of market structure and subsequent retests. Here’s how it works:
For bullish trades:
- Identify an uptrend using higher highs and higher lows
- Wait for a break above the previous high
- Look for a retest of the broken level
- Enter long when price bounces from the retest level
- Place stop loss below the retest level
- Target the next potential resistance level
For bearish trades:
- Identify a downtrend using lower highs and lower lows
- Wait for a break below the previous low
- Look for a retest of the broken level
- Enter short when price rejects the retest level
- Place stop loss above the retest level
- Target the next potential support level
The Retracement Strategy
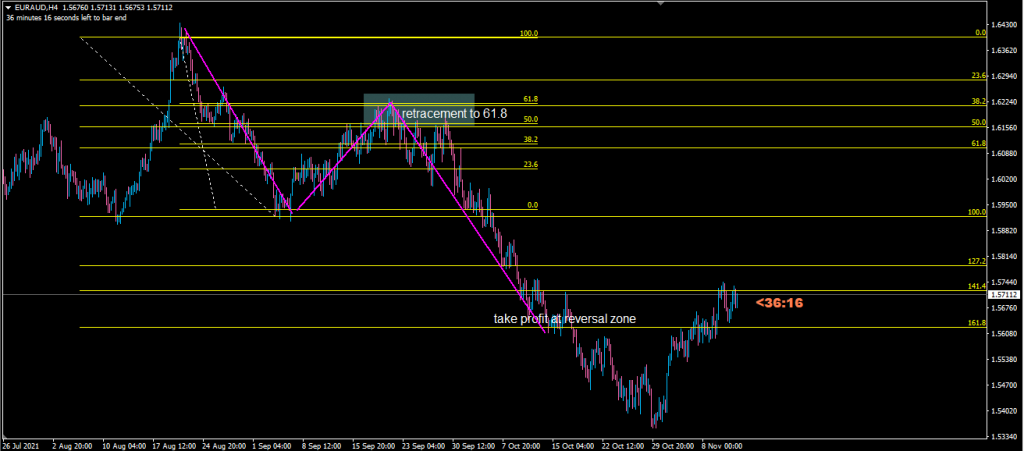
This strategy focuses on trading pullbacks within established trends—perfect for traders who prefer to trade with the trend.

Key elements:
Maintain strict risk management with proper stop losses
Use Fibonacci retracements to identify potential entry levels
Look for confluences between Fibonacci levels and market structure
Enter when price shows signs of resuming the trend.
WHY MARKET STRUCTURE WORKS IN FOREX
Market structure works in Forex because it’s based on fundamental market principles that have remained consistent throughout trading history. Here’s why it’s so effective:
Psychological Foundation
Market structure reflects collective market psychology. When prices break through significant levels, it triggers emotional responses from traders—fear, greed, FOMO—that create predictable patterns.
Institutional Participation
Large institutions and banks use market structure analysis to make trading decisions. When you understand market structure, you’re essentially following the footprints of big money.
Statistical Edge
Historical data consistently shows that market structure patterns repeat with statistical significance. This repetition provides traders with a genuine edge in the markets.
Universal Application
Market structure works across all timeframes and currency pairs. Whether you’re scalping on the 1-minute chart or swing trading on the daily, the principles remain the same.
MARKET PSYCHOLOGY AND STRUCTURE
Understanding market psychology is crucial for interpreting market structure correctly. Every level, pattern, and formation tells a story about what traders are thinking and feeling.
Fear and Greed Cycles
Market structure reveals the eternal battle between fear and greed:
Fear manifests as:
- Sharp selling at resistance levels
- Quick reversals from key levels
- Tight consolidations before major moves
- Breakout failures and false signals
Greed appears as:
- Aggressive buying at support levels
- Extended moves beyond logical targets
- FOMO-driven breakouts
- Overextended price movements
RISK MANAGEMENT WITH MARKET STRUCTURE
Proper risk management is essential when trading market structure. Here’s how to protect your capital while maximising opportunities:
Position Sizing
Conservative approach:
- Risk 1% of account per trade
- Use smaller positions in uncertain conditions
- Increase size only when confidence is high
- Never risk more than you can afford to lose
Aggressive approach:
- Risk up to 2% per trade
- Use larger positions with strong setups
- Scale into positions gradually
- Maintain overall portfolio risk limits
Stop Loss Placement
Structure-based stops:
- Place stops beyond key structure levels
- Use previous highs/lows as reference points
- Allow for normal market fluctuation
- Adjust stops based on timeframe
Take Profit Strategies
Target-based exits:
Trail stops to lock in profits
Use next structure level as target
Employ multiple targets with partial profits
Use risk-reward ratios of at least 1:2.
COMMON MISTAKES IN MARKET STRUCTURE ANALYSIS
Even experienced traders make mistakes when analysing market structure. Here are the most common errors to avoid:
Over-Analysis Paralysis
The problem: Spending too much time analysing and missing trading opportunities
The solution:
- Set time limits for analysis
- Focus on major structure levels only
- Trust your initial assessment
- Take action when setups align
Ignoring Multiple Timeframes
The problem: Focusing on only one timeframe and missing the bigger picture
The solution:
- Always check higher timeframes first
- Ensure lower timeframe trades align with higher timeframe structure
- Use multiple timeframes for confirmation
- Maintain awareness of overall trend direction
Forcing Trades
The problem: Trying to find trades when market structure isn’t clear
The solution:
- Wait for clear, high-probability setups
- Accept that some days offer no good opportunities
- Focus on quality over quantity
- Preserve capital for better opportunities
MARKET STRUCTURE ACROSS DIFFERENT SESSIONS
Market structure behaves differently depending on trading sessions:
London Session (8:00-16:00 GMT)
- Highest volume and volatility
- Clearest structure breaks and retests
- Best time for breakout strategies
- Multiple opportunities available
New York Session (13:00-21:00 GMT)
- Overlaps with London for maximum volume
- Trend continuation common
- Good for momentum strategies
- US news can cause structure violations
Asian Session (23:00-8:00 GMT)
- Generally lower volatility
- Range-bound trading more common
- Structure levels often tested but not broken
- Good for range trading strategies
ADVANCED MARKET STRUCTURE CONCEPTS
Order Blocks
Order blocks are areas where large institutions have placed significant orders. These zones often align with market structure levels and provide high-probability trading opportunities.
Characteristics of order blocks:
- Areas where price moved aggressively away
- Often coincide with support and resistance levels
- Provide strong reversal zones
- Can be identified on multiple timeframes
Market Structure Shifts
A market structure shift occurs when the market changes from one phase to another—from uptrend to downtrend, or from trending to ranging.
Signs of structure shifts:
- Failure to make new highs in an uptrend
- Break of significant support levels
- Change in the character of price movement
- Volume and momentum divergences
The Confluence Trading Method
This method combines multiple technical factors with market structure for higher probability setups:
Types of confluence:
- Structure level + Fibonacci retracement
- Support/resistance + candlestick pattern
- Trend line + previous high/low
- Multiple timeframe structure alignment
BUILDING YOUR MARKET STRUCTURE TRADING PLAN
Creating a systematic approach to market structure trading is essential for long-term success:
Daily Routine
Morning Analysis (15-30 minutes):
- Review major currency pairs on daily charts
- Identify key support and resistance levels
- Note any significant news or events
- Plan potential trade setups for the day
During Market Hours:
- Monitor price action at key levels
- Execute trades when structure signals align
- Manage open positions according to plan
- Take notes on market behavior
End of Day Review:
- Analyse executed trades and their outcomes
- Update charts with new structure levels
- Plan for the next trading session
- Review and adjust trading plan if needed
Weekly Analysis
Higher Timeframe Review:
Update long-term market bias
Analyse weekly charts for major structure changes
Identify long-term support and resistance levels
Note any significant pattern formations
CONCLUSION
Market structure in Forex isn’t just another trading concept it’s the foundation upon which all successful trading strategies are built.
By understanding how support and resistance levels, supply and demand zones, and chart patterns work together, you gain a significant advantage in the markets.
The beauty of market structure analysis lies in its universality. Whether you’re a scalper looking for quick profits or a swing trader holding positions for days, these principles remain constant.
The key is to start with higher timeframes to understand the bigger picture, then drill down to lower timeframes for precise entries.
Remember, mastering market structure takes time and practice. Start by focusing on major currency pairs, use a systematic approach to your analysis, and always maintain proper risk management.
Don’t try to catch every move wait for high-probability setups that align with clear structure levels.
Most importantly, keep your analysis simple and focused. The market rewards those who can identify the most obvious levels and patterns, not those who over-complicate their analysis with too many variables.
Start implementing these market structure concepts in your trading today. Begin with demo trading to build confidence, then gradually transition to live trading as your skills develop.
With patience, discipline, and consistent application of these principles, you’ll soon discover why market structure analysis is considered the cornerstone of professional trading.


