Today, we will be discussing the best time to trade volatility 75 index; keep in mind that am referring to Deriv synthetic index.
At the time of writing this article, there are two types of Volatility 75 index, the VIX 75 which is an index measuring the volatility of the S&P 500 stock index, is also called the fear index while the other is the synthetic index created by Deriv which is exclusive and imitate actual market movements.
The index is available for trading 24/7 and unaffected by conventional market hours, world events, and market dangers.
- HOW TO TRADE VOLATILITY INDEX 75
- BEST TIME TO TRADE VOLATILITY 75 INDEX
- VOLATILITY 75 INDEX STRATEGY
- BEST TIME TO TRADE VOLATILITY 75 INDEX IN NIGERIA
- VOLATILITY 75 INDEX KILLER STRATEGY USING MT5 INDICATORS
- BEST TIME TO TRADE SYNTHETIC INDICES
- WHAT IS THE BEST STRATEGY FOR VOLATILITY 75 INDEX?
- WHAT TIME DOES THE VOLATILITY INDEX OPEN?
- WHAT IS THE BEST TIME TO TRADE SYNTHETIC INDICES?
- WHAT DRIVES VOLATILITY 75 INDEX?
- CONCLUSION

HOW TO TRADE VOLATILITY INDEX 75
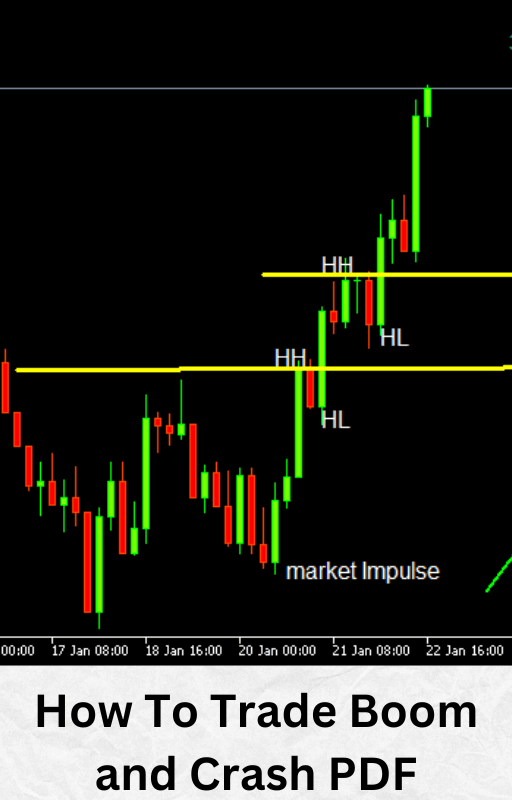
There are many ways to trade volatility index 75 while making use of all the necessary default MT5 tools from trend lines to Fibonacci tool.
Some traders even make use of custom indicators, but in all one consistent truth about general trading is that market structure will always win.
That being said if you want to know how to trade volatility index 75 then you have to pay attention to market structure trading principles.
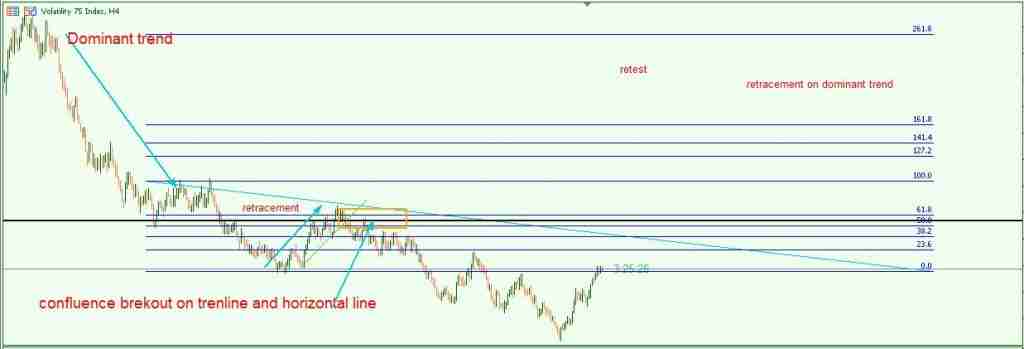
Now let me go to explain this with an image live chart technical analysis above.
- Identify the dominant trend
- Wait for market retracement
- Join in on continuation on the Fibonacci retracement zone (better when the fib zone aligns with support and resistance) – using Chart pattern.
- Use multiple timeframe analysis (trade entry from lower timeframe).
RELATED: HOW TO TRADE VOLATILITY 75 1S
IDENTIFY THE DOMINANT TREND
As straightforward as this may seem, this is where many traders fail. The first step in successfully trading any financial asset is to identify the dominating trend.
Looking at the market from a longer timeframe will help you identify the dominant trend.
You can read up on Dominant trends to know more about them.
WAIT FOR MARKET RETRACEMENT
The market will put your ability to wait to join the dominating trend to the test here.
After a recent market impulse in any direction, your goal as a trader is to wait for the market to settle back to a Fibonacci zone that lines up with a support and resistance level.
Read up on all you need to know on the Fibonacci retracement.
JOIN IN ON THE CONTINUATION OF THE FIBONACCI RETRACEMENT ZONE
Price will settle at one of the Fibonacci retracement zones following a retracement or pullback on a trending market; this is the point at which a lower timeframe entry is chosen.
USE MULTIPLE TIMEFRAME ANALYSIS
When it comes to trading, using multiple time frames is a necessity. The use of different timeframe analysis will reduce risk and help you focus your trade entry as a financial trader, whether you are trading forex or synthetic markets.
After determining the dominant trend, you can locate a chart pattern at a Fibonacci zone on a lower period for market entry.
To understand more about multiple timeframe analysis read up on market structure.
BEST TIME TO TRADE VOLATILITY 75 INDEX
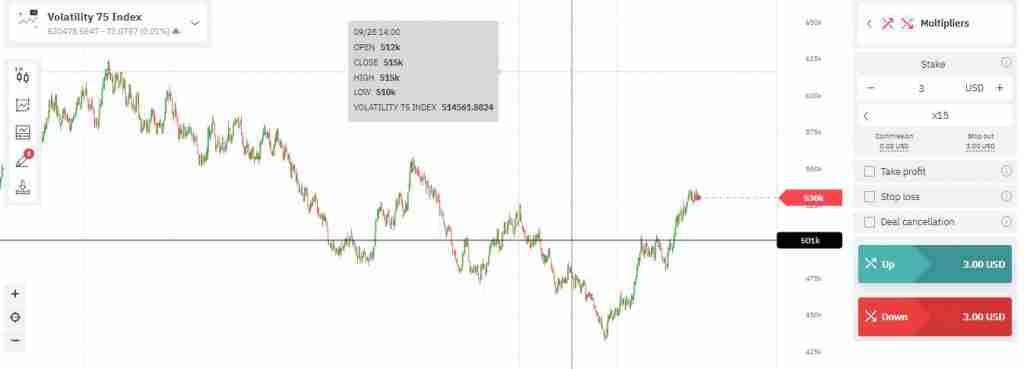
The best time to trade Volatility 75 index is beyond a time or day of the week, it is rather when all the market conditions have been completed after a proper technical analysis.
For example breakout of support and resistance, chart pattern, Fibonacci retracement zones, and more.
VOLATILITY 75 INDEX STRATEGY
I’ve learned through my years of trading that having a volatility 75 index strategy goes beyond just using a few indicators. Understanding market structure is the key to developing a successful volatility 75 index strategy.
The act of naked trading, which corresponds to this market structure, necessitates the employment of standard MT5 platform tools like horizontal lines, trend lines, Fibonacci tool support and resistances, chart patterns, numerous time frames, and more.
To be clear, indicators are not bad for trading, but because they lag, I only use them as a backup option in my trade and have the option of not adding any at all.
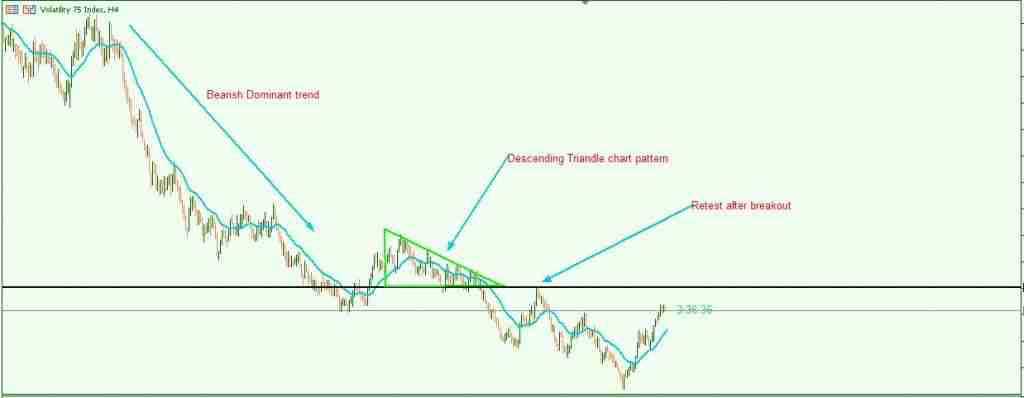
This topic will not be complete without showing you a visual example of a volatility 75 index strategy using the naked chart, default MT5 tools, and maybe one indicator.
See the example below:
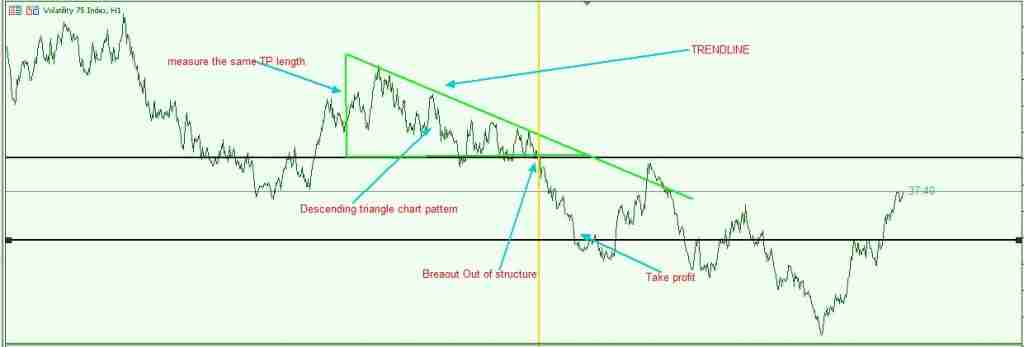
In the image above, my analysis began on H4 with a strong dominant trend, followed by H1 with a breakout from the market structure pattern and a chart continuation pattern (descending triangle).
For a thorough understanding, I will recommend you read up on price action and market structure.
BEST TIME TO TRADE VOLATILITY 75 INDEX IN NIGERIA
I wish it was that easy to tell you that the best time to trade volatility 75 index in Nigeria is a certain time.
I do not want to waste much of your time, beating about. I will go straight to the point and give you what you need to know to help you trade Volatility 75 index successfully.
The best time to trade Volatility 75 index in Nigeria is to first identify the market dominant trend and then follow through with a break in market structure.
I will recommend you read this article from the top and see other important articles you need to read up on.
VOLATILITY 75 INDEX KILLER STRATEGY USING MT5 INDICATORS
I have always told traders that the best volatility 75 index strategy that will ever be first, understanding market structure. I think I have over-emphasized this.
As a V75 index trader, the earlier you stop depending on custom indicators the better for you.
The truth of the matter is whatever MT5 indicators you plan to use, you should make it a secondary option after market analysis using the naked chart.
In other words, the volatility 75 index strategy is market structure trading.
Go to the top of this post and read up on all the provided links to market structure trading.
BEST TIME TO TRADE SYNTHETIC INDICES
Synthetic indices are unlike forex(currency) trading which is affected by the market hour. They are designed to have consistent liquidity which makes them perfect for technical analysis trading.
That being said, since synthetic indices are not affected by market time zone, and they are fully technical trading, the best time to trade synthetic indices is at the break of the market structure of the indices.
This will require the use of support and resistance, trendline, chart pattern, horizontal line, Fibonacci, and more.
Feel free to read up on how to trade synthetic indices.
WHAT IS THE BEST STRATEGY FOR VOLATILITY 75 INDEX?
The best strategy for Volatility 75 index is market structure trading.
WHAT TIME DOES THE VOLATILITY INDEX OPEN?
For VIX 75 (fear index) it is from 2:00 a.m. to 8:15 a.m. CT while the Deriv synthetic Volatility index is 24/7.
WHAT IS THE BEST TIME TO TRADE SYNTHETIC INDICES?
The best time to trade synthetic indices is when a break in market structure is confirmed using MT5 default tools like Fibonacci, trend line, and basic trading principles like support and resistance.
It is also best to trade synthetic indices after a market impulse and retracement, to join in on the dominant trend.
WHAT DRIVES VOLATILITY 75 INDEX?
The VIX is a measure of market anxiety; when it rises above 30, the market is anxious.
The VIX value directly relates to the degree of fear.
While Deriv Volatility 75 index is backed by a cryptographically safe random number generator.
CONCLUSION
As a trader every time you think of the best time to trade volatility 75 index, think of market structure and not a particular time of day.


Leave a Reply