I can guarantee you that understanding how to correctly draw a Fibonacci retracement is a necessary component of becoming a successful FX trader.
I’ve cut out all the complicated Fibonacci retracement terminology in this article so that you can clearly understand only the information that is essential for drawing Fibonacci retracements.
You can discover straightforward responses to the challenging queries people have about how to draw Fibonacci at the end of this article.
- HOW TO DRAW FIBONACCI RETRACEMENT CORRECTLY
- HOW TO DRAW FIBONACCI EXTENSION
- FIBONACCI EXTENSION LEVELS
- FIBONACCI RETRACEMENT VS EXTENSION
- BEST TIME FRAME FOR FIBONACCI RETRACEMENT
- HOW TO DRAW FIBONACCI RETRACEMENT IN UPTREND
- HOW TO DRAW FIBONACCI RETRACEMENT IN DOWNTREND
- WHAT ARE THE BEST FIBONACCI RETRACEMENT SETTINGS
- HOW DO YOU USE FIBONACCI RETRACEMENT FOR BEGINNERS
- CONCLUSION

HOW TO DRAW FIBONACCI RETRACEMENT CORRECTLY
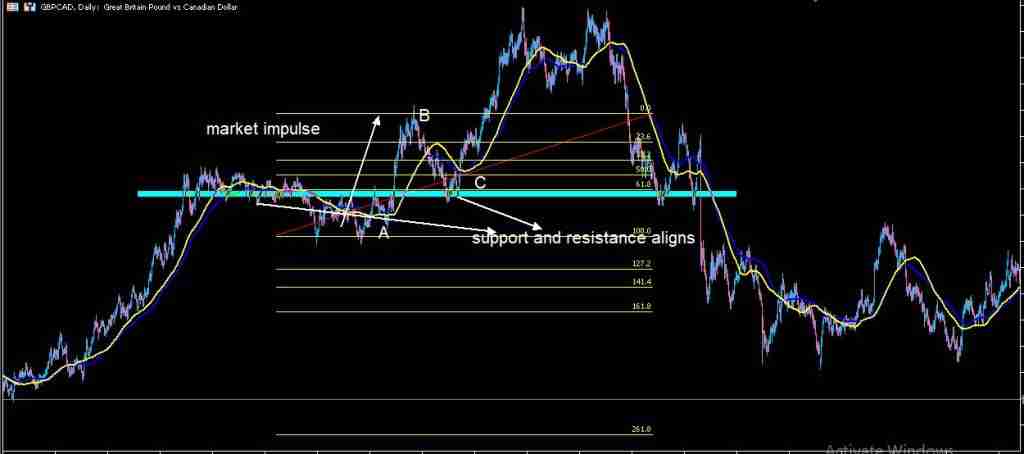
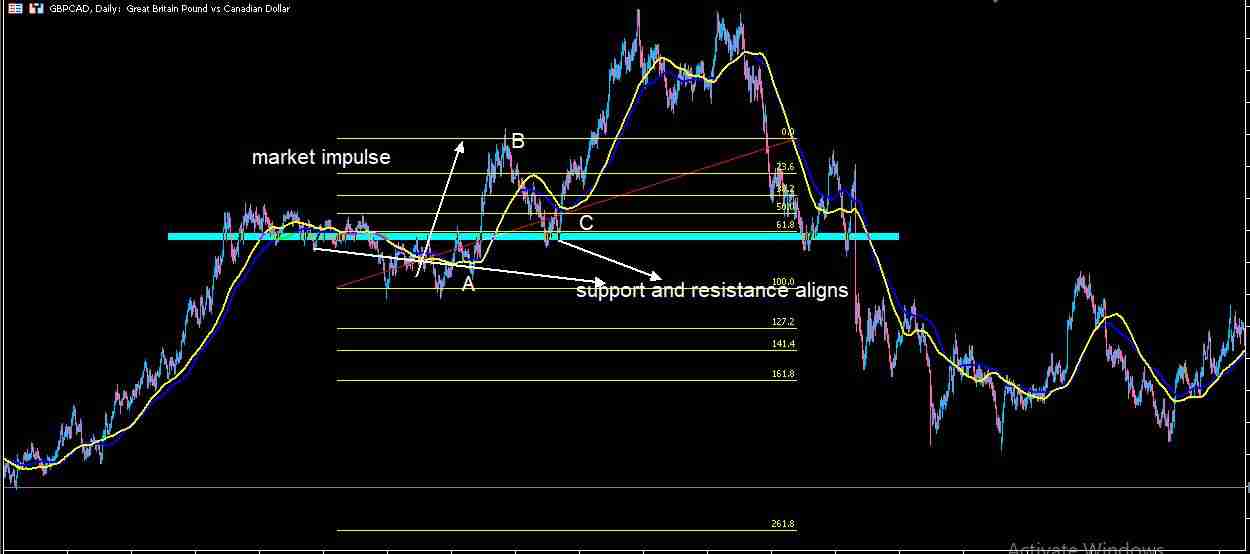
This is how to draw a Fibonacci retracement correctly using previous market data with image illustrations below.
Here are things to look out for to draw Fibonacci retracement correctly.
- Identify a recent market impulse
- Starting point of market impulse will be A, point B will be the highest point of impulse before retracement, and point C will be at one of the retracement levels (38.2, 50,61.8)before trend resumption or continuation.
- Retracement levels align with previous support and resistant zones
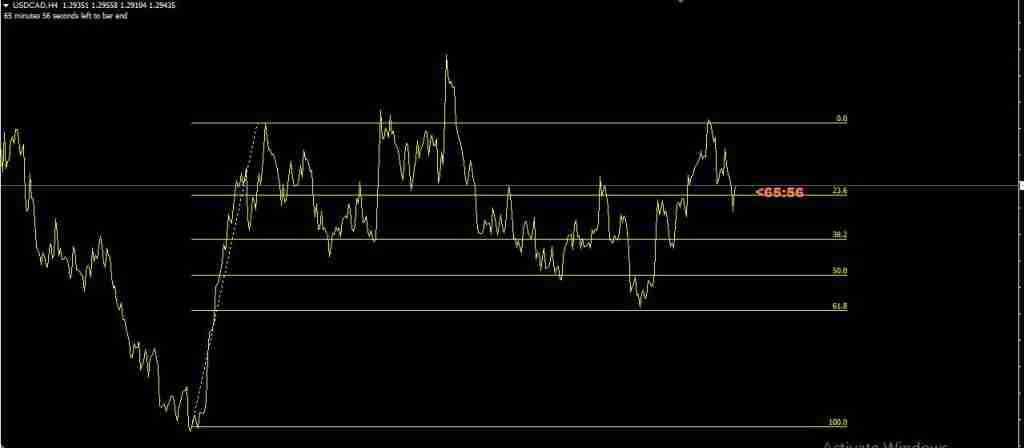
RELATED: FIBONACCI RETRACEMENT LEVELS ABOVE 100
HOW TO DRAW FIBONACCI EXTENSION
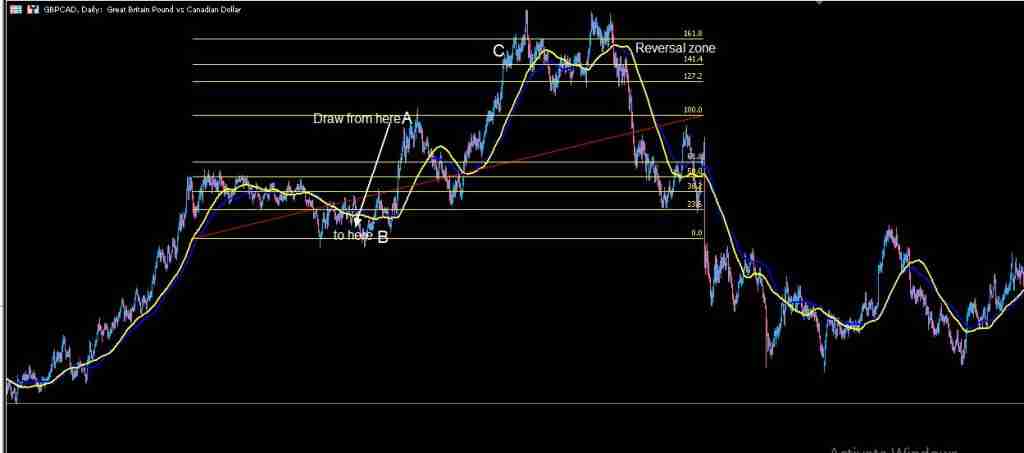
Drawing Fibonacci extension is similar to drawing Fibonacci retracement. Fibonacci extension is drawn from point A, the peak of the recent market impulse to point B, the beginning of the market impulse, and point C will be at one of the major Fibonacci reversal levels. (127.2, 141.1, and 161.8)
All these are done after a market impulse has been established.
See the image illustration below.
FIBONACCI EXTENSION LEVELS
Fibonacci extension levels are zones of possible market reversal after a long market trend and of course, the market must have hit one of the retracement levels and resume the dominant trend direction.
Fibonacci extension levels are also called reversal; there are three major Fibonacci extension levels which are: 127.2, 141.4, and 161.8.
FIBONACCI RETRACEMENT VS EXTENSION
There are simple ways to know the difference between Fibonacci retracement and extension
Below is a table showing the differences between Fibonacci retracement and extension
| FIBONACCI RETRACEMENT | FIBONACCI EXTENSION |
| Drawn from Point A(recent impulse beginning) to Point B(impulse end) | Drawn from Point B (recent impulse end) to Point A (impulse beginning) |
| Fibonacci retracement uses a recent market impulse to determine possible reversal zones after knowing the dominant trend. Simply put Fibonacci extension is the future | Fibonacci retracement is using a recent market impulse to determine possible reversal zones after knowing the dominant trend. Simply put Fibonacci extension is the future |
| Major Fibonacci retracement levels are 38.2, 50 and 61.8 | Major Fibonacci extension levels are 127.2,141.4 and 161.8 |
BEST TIME FRAME FOR FIBONACCI RETRACEMENT
Although each forex trader has a preferred time frame that best suits their trading style, the most popular time frames for drawing Fibonacci retracements are the 15-minute to daily charts.
As a result, successful traders frequently pay attention to the above timeframe for both market analysis and determining their Fibonacci retracement levels, and you should too.
Higher timeframes (H1 and above) are another good period for Fibonacci retracements since they provide a clearer picture of the market’s dominating trend than lower timeframes offer.
On a higher period, the Fibonacci retracement levels line up correctly with stronger support and resistance zones; medium- to long-term traders seek these areas for market entry.
HOW TO DRAW FIBONACCI RETRACEMENT IN UPTREND
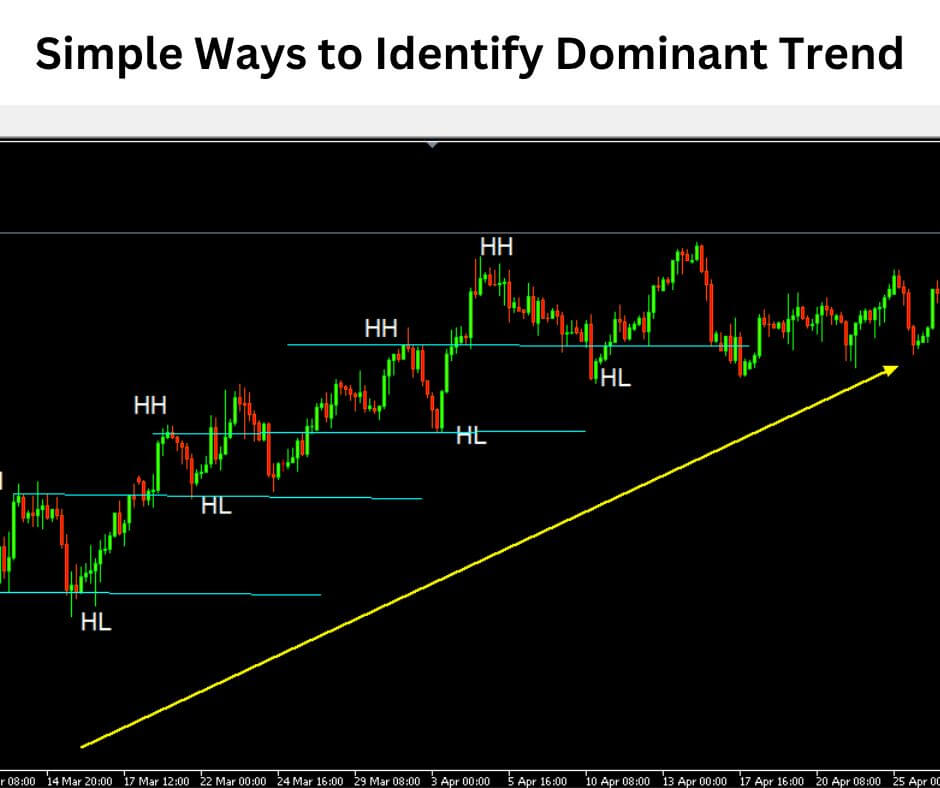
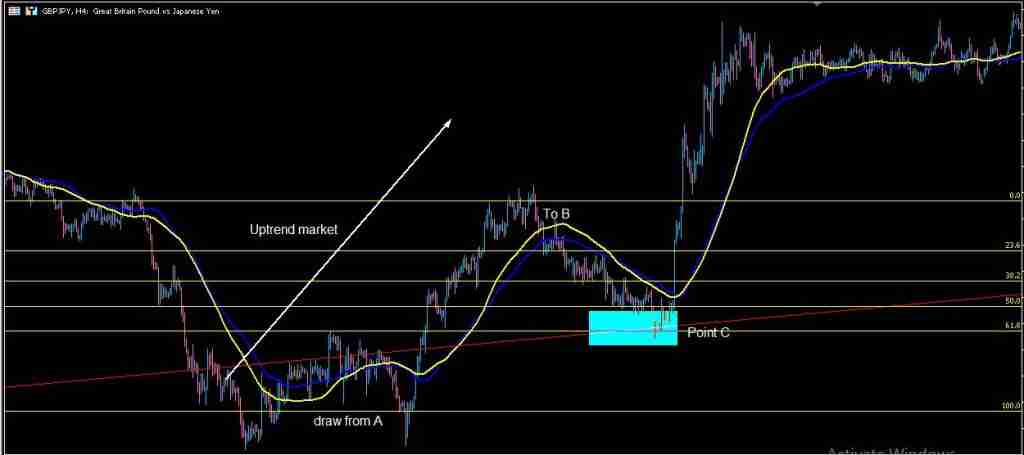
The best way to draw Fibonacci retracement in an uptrend is to start with a recent market impulse in an uptrend, this impulse will be the first strong move of the market in a bullish dominant trend.
Draw your Fibonacci from the beginning of the bullish move right to the top where it starts to fall.
The beginning of the bullish move will be Point A and the top will be Point B. Point C will be at one of the Fibonacci retracement levels.
See the image Illustration below
HOW TO DRAW FIBONACCI RETRACEMENT IN DOWNTREND
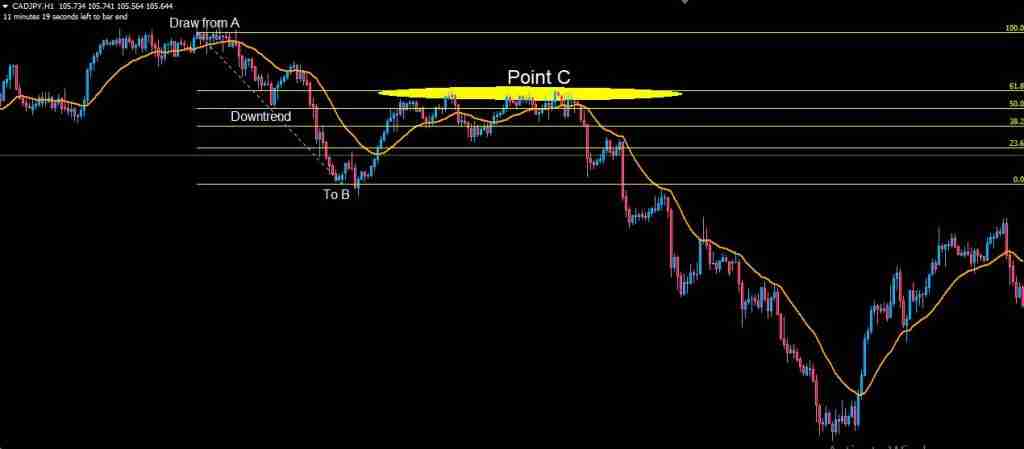
The best way to draw Fibonacci retracement in a downtrend is to start with a recent market impulse in a downtrend, this impulse will be the first strong move of the market in a bearish dominant trend.
Draw your Fibonacci from the beginning of the bearish move right to the bottom where it starts to retrace right back.
The beginning of the bearish move will be Point A and the bottom will be Point B. Point C will be at one of the Fibonacci retracement levels.
See the image Illustration below
WHAT ARE THE BEST FIBONACCI RETRACEMENT SETTINGS
The Fibonacci tool has a wide range of settings and levels, but there are only a select few that effective traders pay attention to.
Consequently, the best Fibonacci retracement settings are 38.2, 50, and 61.8 based on the actions of forex traders.
The forex market always reacts significantly when prices reach the specified level since the aforementioned settings are the Fibonacci levels that forex traders observe the most closely.
These three important Fibonacci levels are important in deciding how far the market will move once the price reaches any of the FIB levels, so if you are new to the forex market, be aware of this.
HOW DO YOU USE FIBONACCI RETRACEMENT FOR BEGINNERS
As a newcomer using Fibonacci retracement, you should be aware that there are three main levels of retracement.
To obtain the proper Fibonacci retracement levels, you should also be familiar with how to draw the Fibonacci sequence correctly.
I’ll make it very easy for you by outlining the basics of how to use Fibonacci retracement for a newbie.
- Identify recent market impulse/dominant trend
- Wait for price retracement
- Draw Fibonacci from Point A to Point B to locate the Fib level at Point C
I have given detailed information above on how to use the Fibonacci tool correctly.
You can read more on Fibonacci tool trading in my previous articles.
CONCLUSION
The Fibonacci tool has been shown to provide traders with attractive discount zones for re-entry and is particularly helpful for technical analysis trading. However, the Fibonacci tool should not be used in isolation.
As a forex trader, it will benefit you greatly if you have a fundamental understanding of market structure.
This will enable you to view the forex market from a more comprehensive and professional perspective and will help you make better decisions regarding the market’s dominant trend.
