When I began trading Deriv synthetic indices, I was eager to find the perfect volatility 25 index strategy.
I kept searching for a magical approach, only to realize that true and consistent profitability requires understanding market psychology and acquiring the essential trading knowledge used by professional traders.
In this article, I assure you that if you take the time to carefully read and absorb what I’m about to share, it will significantly enhance your trading skills.
Moreover, the insight applies to any trading instrument, making them universally valuable.
Always keep in mind these will work much better when you have a substantial amount of capital.
- WHAT IS VOLATILITY 25 INDEX?
- VOLATILITY 25 INDEX STRATEGY
- BEST TIME TO TRADE VOLATILITY 25 INDEX
- VOLATILITY 25 (1S) INDEX
- VOLATILITY 25 INDEX LIVE CHART
- VOLATILITY 25 INDEX TRADINGVIEW
- VOLATILITY 50 (1S) INDEX STRATEGY
- WHAT IS THE BEST STRATEGY FOR VOLATILITY INDEX
- WHAT IS THE BEST DAY TO TRADE VOLATILITY INDICES
- HOW DO YOU PROFIT FROM VOLATILITY
WHAT IS VOLATILITY 25 INDEX?
The Volatility 25 index, found exclusively on Deriv, imitates real market behavior but remains immune to global events.
You can trade it all day, every day, without being interrupted by holidays like regular currency trading.
Traders skilled in technical analysis can benefit from its consistency, avoiding unexpected shocks from news events.
With a steady 25% volatility, ticking every 2 seconds, the Volatility 25 index requires a minimum lot size of 0.50 and is exclusively tradable on MT5.

VOLATILITY 25 INDEX STRATEGY
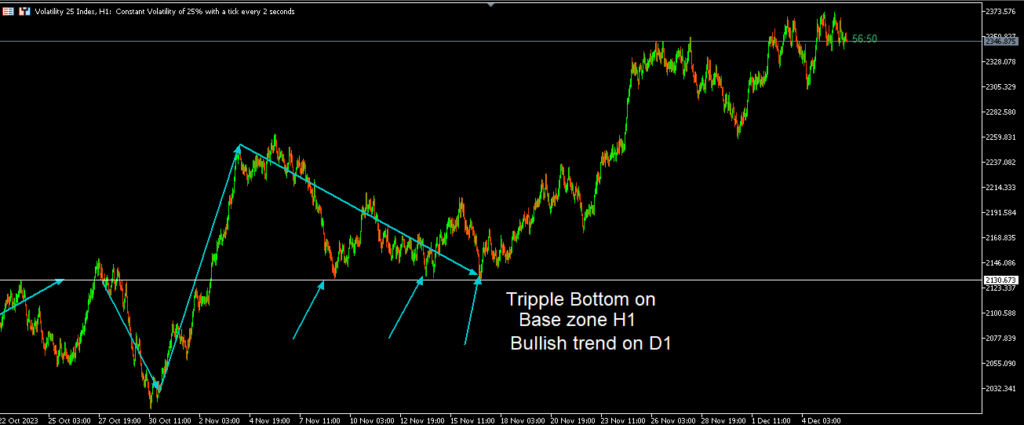
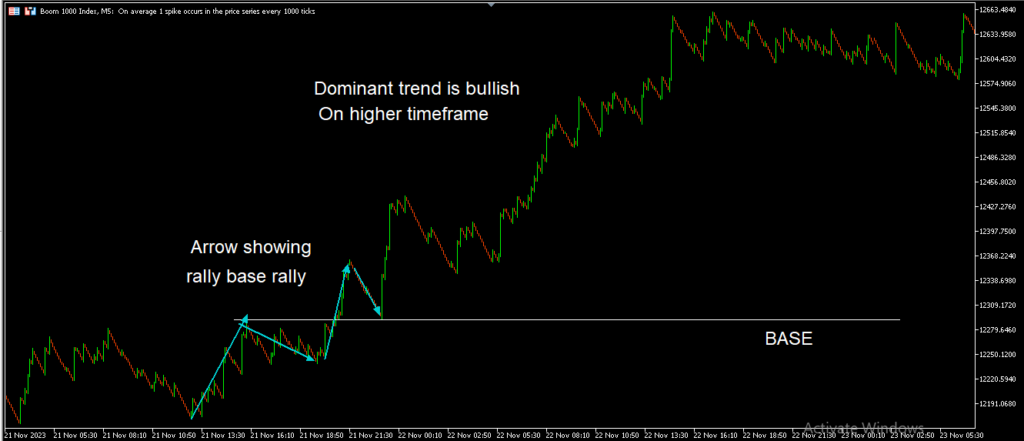
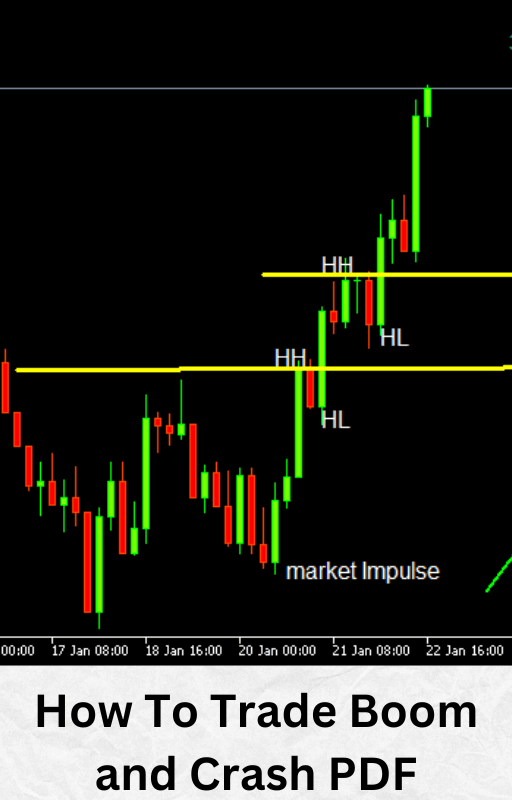
A consistent volatility 25 index strategy will require you to pay attention to market-dominant trend from a higher timeframe, rally base rally or drop base drop, (market structure psychology) top-down analysis (go on a lower time frame for market entry.
See the Image Live example below:
BEST TIME TO TRADE VOLATILITY 25 INDEX
Every time I see financial traders ask this question, I always have the same answer, if there was a best time to trade Volatility 25 index or any other financial trading instrument then everyone would be making money.
The best time to trade Volatility 25 index has nothing to do with time rather, it’s in understanding market psychology.
VOLATILITY 25 (1S) INDEX
Volatility 25 (1s) index is another uniquely designed Deriv indices, it moves at a constant volatility of 25% with a tick every 1 second. Its minimum trade volume or lot size is 0.005
It can be accessed on Deriv 24/7 through MT5 or Trading View.
VOLATILITY 25 INDEX LIVE CHART
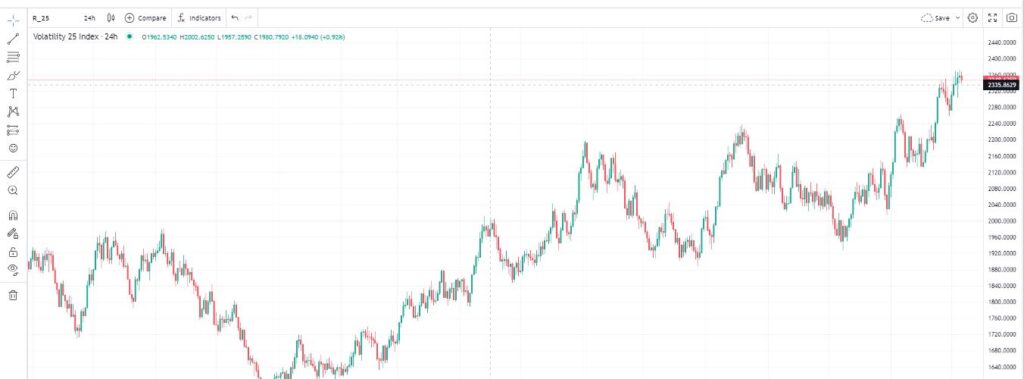
You can see volatility 25 index live chart using MT5 or trading view (https://tradingview.deriv.com/deriv)
On the live chart, you will find all the necessary default tools needed to assist you in making a proper trading decision just as it applies to trading currencies.
VOLATILITY 25 INDEX TRADINGVIEW
Explore the Volatility 25 index trading view at (https://tradingview.deriv.com/deriv) for a comprehensive set of tools.
Tailor your chart’s appearance to align with your trading strategy, utilizing the provided resources for optimal customization.
Also if you want to find Boom and Crash on Tradingview you can click the link above.
VOLATILITY 50 (1S) INDEX STRATEGY
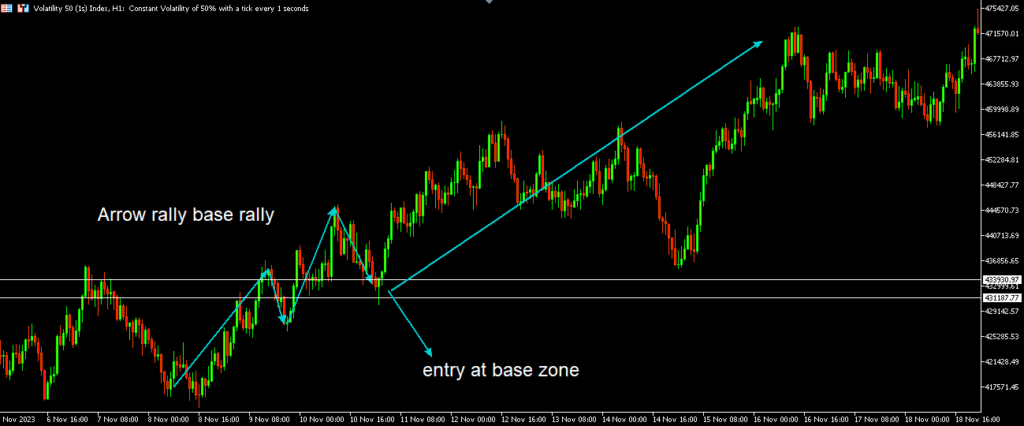
To achieve consistent profitability when trading Volatility 50 (1s), it’s crucial to adhere to a versatile strategy applicable across various financial instruments.
A key component is to understand market psychology, starting with identifying market bias, which can address more than 85% of trading challenges.
Incorporating top-down analysis and recognizing patterns like rally base rally and drop base drop is essential.
The unique characteristic of Volatility 50 (1s), being unaffected by global events, makes it particularly responsive to market technical analysis.
Market bias, a crucial element, involves assessing the dominant trend on a higher timeframe.
For a clearer grasp, refer to the live image example of Volatility 25 (1s) provided below.
This comprehensive approach enhances your ability to navigate and capitalize on the dynamic nature of the market.
WHAT IS THE BEST STRATEGY FOR VOLATILITY INDEX
To trade volatility index or any other financial instrument, there truly isn’t a single Holy Grail trading strategy.
I can promise you one thing, though, if you start paying attention to the knowledge and strategies that expert traders employ in their trading, such as top-down analysis, rally base rally, drop base drop, and market psychology.
You’ll start to consistently make a profit from your trades.
Above all, before placing any trades, you must exercise patience and wait for market setups to complete.
You can read this article from the top to see real-time examples of how to apply the previously discussed strategies for volatility index, and it will also provide you with the finest plan.
WHAT IS THE BEST DAY TO TRADE VOLATILITY INDICES
Deriv volatility indices operate 24/7, making the concept of a specific “best day to trade volatility indices” not applicable.
Profitability in synthetic trading isn’t tied to a particular day; rather, success hinges on aligning your market setup with your strategy.
A sound approach involves incorporating market psychology principles, such as rally base rally, drop base drop, and top-down analysis.
The best day to trade volatility indices emerges when your strategy aligns seamlessly with your market setup. Live image examples illustrating this synergy are provided above.
For a deeper understanding of market psychology, start reading from the beginning of this article.
This comprehensive resource aims to enhance your grasp of trading dynamics, aiding in identifying favorable opportunities in the volatility indices market.
HOW DO YOU PROFIT FROM VOLATILITY
Many Deriv synthetic traders commonly pose a common question, only to be dissatisfied with the response.
Contrary to common opinion, profiting from volatility does not rely on having the perfect indicator or knowing the best time of day to trade.
Understanding market psychology, also known as market structure, is critical to constantly succeeding in trading the Deriv volatility index.
Understanding concepts such as determining the dominating trend, rally base rally, drop base drop, top-down analysis, and others is required.
A full understanding of these ideas, together with their proper applications in real-time, opens the road for long-term profits in trading volatility indices or any financial asset.