You’re staring at your trading screen, watching price movements bounce around like a pinball machine.
Charts look chaotic, signals seem contradictory, and you’re wondering if there’s a simpler way to make sense of it all.
What if I told you that three simple lines could transform your trading game entirely?
The 8 13 21 EMA strategy has quietly become one of the most reliable approaches in forex trading.
This isn’t just another complicated system that requires a PhD in mathematics.
It’s elegantly simple, yet powerful enough to help you spot trends, time your entries, and protect your capital.
But here’s the twist that most traders don’t realise.
- WHAT IS THE 8,13,21 EMA STRATEGY?
- HOW THE 8,13,21 EMA STRATEGY WORKS
- IS THE 8,13,21 EMA STRATEGY EFFECTIVE IN TRADING?
- BEST TIMEFRAMES FOR THE 8,13,21 EMA STRATEGY
- ADVANCED TECHNIQUES: MARKET STRUCTURE INTEGRATION
- RISK MANAGEMENT WITH THE 8,13,21 EMA STRATEGY
- VARIATIONS OF THE EMA STRATEGY
- COMMON MISTAKES TO AVOID
- PRACTICAL EXAMPLE: TRADING GBP/USD
- OPTIMIZING YOUR EMA STRATEGY
- TECHNOLOGY AND TOOLS
- BUILDING YOUR TRADING PLAN
- PSYCHOLOGY AND DISCIPLINE
- CONCLUSION: MASTERING THE 8,13,21 EMA STRATEGY
WHAT IS THE 8,13,21 EMA STRATEGY?
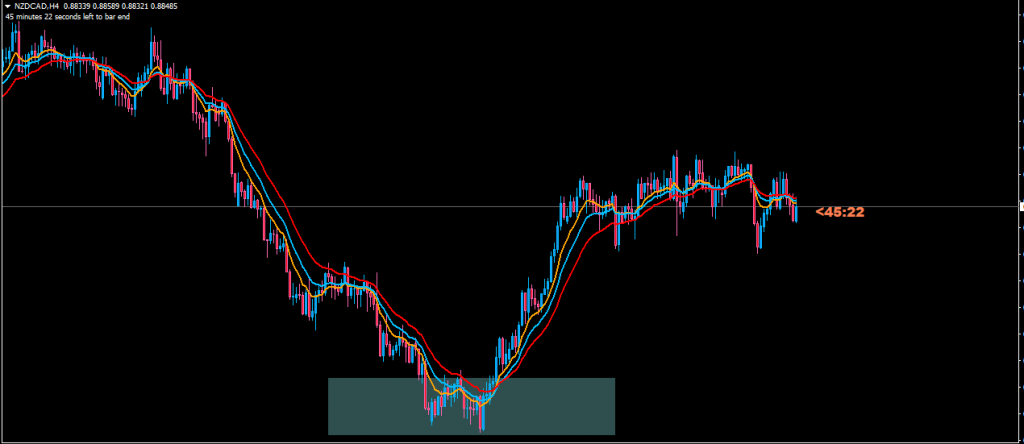
The 8,13,21 EMA strategy uses three exponential moving averages working together like a well-orchestrated team.
Each EMA has a specific role:
- 8 EMA: The fastest-moving line that reacts quickly to price changes
- 13 EMA: The middle ground that filters out noise whilst staying responsive
- 21 EMA: The slower line that shows the broader trend direction
Unlike simple moving averages, exponential moving averages give more weight to recent prices. This means they respond faster to market changes, making them perfect for active forex trading.
HOW THE 8,13,21 EMA STRATEGY WORKS
The Basic Setup
Setting up this strategy is straightforward:
- Add 8 EMA (colour: Orange)
- Add 13 EMA (colour: Blue)
- Add 21 EMA (colour: Red)
The magic happens when these lines interact with each other and price action.
Entry Signals
Bullish Signal (Buy):
- 8 EMA crosses above both 13 EMA and 21 EMA
- Price is above all three EMAs
- EMAs are stacked in ascending order (8 > 13 > 21)
Bearish Signal (Sell):
- 8 EMA crosses below both 13 EMA and 21 EMA
- Price is below all three EMAs
- EMAs are stacked in descending order (8 < 13 < 21)
Support and Resistance Levels
In trending markets, the 13 and 21 EMAs act as dynamic support and resistance:
- Bullish trends: 13 and 21 EMAs provide support levels
- Bearish trends: 13 and 21 EMAs act as resistance levels
This gives you excellent areas to add to winning positions or set stop losses.
IS THE 8,13,21 EMA STRATEGY EFFECTIVE IN TRADING?
The short answer is yes, but with important caveats. This strategy works best when combined with proper market structure analysis. Here’s why it’s effective:
Strengths:
- Simple to understand and implement
- Works across multiple timeframes
- Provides clear entry and exit signals
- Filters out market noise effectively
- Adapts well to trending markets
Limitations:
- Struggles in ranging markets
- Can produce false signals during consolidation
- Requires confirmation from market structure
- Not suitable as a standalone system
BEST TIMEFRAMES FOR THE 8,13,21 EMA STRATEGY
Different timeframes offer different advantages:
4-Hour Chart
The best moving average for 4 hour chart setups often includes the 8,13,21 combination because:
- Filters out intraday noise
- Provides reliable trend signals
- Perfect for swing trading
- Allows time for proper analysis
15-Minute Chart
For day traders, the 15-minute chart works well when:
- You first analyse the H1 chart for market structure
- Look for breakout entries after structure completion
- Use higher timeframe bias for direction
Daily Chart
Long-term position traders benefit from:
Better risk-to-reward ratios
Strong trend identification
Reduced false signals

ADVANCED TECHNIQUES: MARKET STRUCTURE INTEGRATION
The real secret to making this strategy profitable lies in combining it with market structure analysis. Here’s how:
Step 1: Identify Market Structure
Before taking any EMA signal, check for:
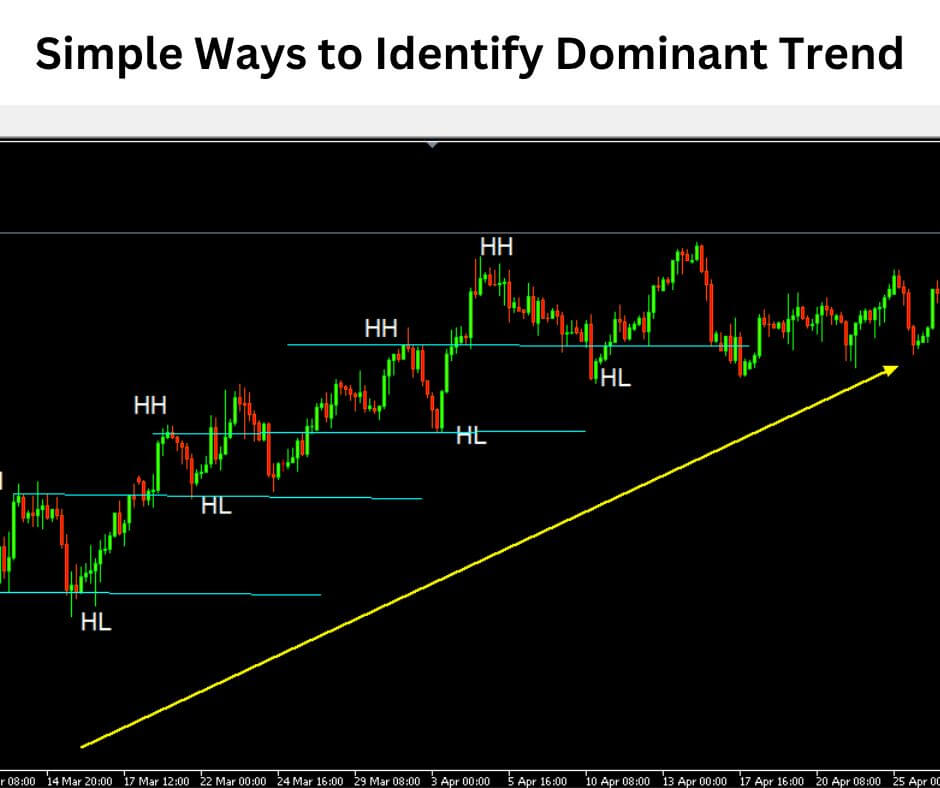
- Higher highs and higher lows (uptrend)
- Lower highs and lower lows (downtrend)
- Key support and resistance levels
- Chart patterns (triangles, flags, channels)
Step 2: Wait for Structure Completion
Only take EMA signals after:
- A clear break of structure
- When a trend ends becomes crucial here
- Volume confirmation (if available)
Step 3: Time Your Entry
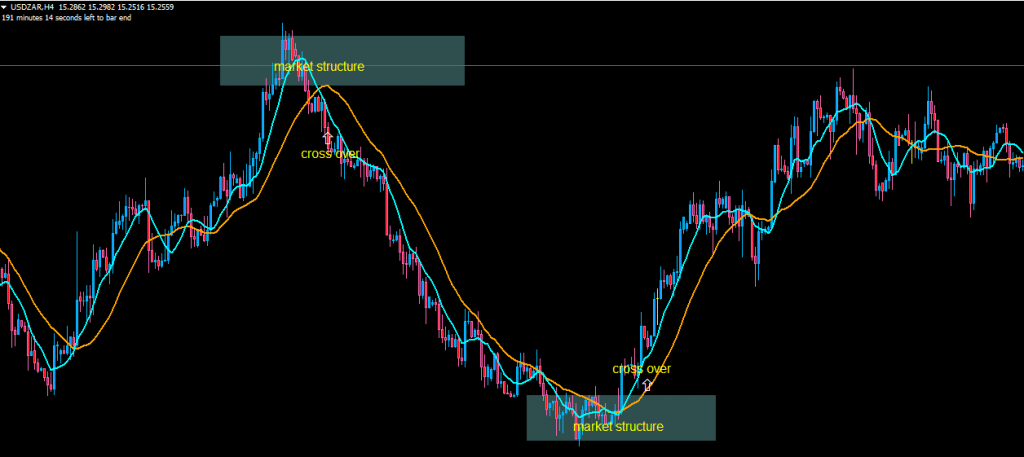
Use the EMA crossover as your trigger, but only after structure supports your direction.
RISK MANAGEMENT WITH THE 8,13,21 EMA STRATEGY
Proper risk management separates profitable traders from the rest. Here’s your framework:
Stop Loss Placement
- Conservative: Below/above the 21 EMA
- Aggressive: Below/above the most recent swing point
- Balanced: Below/above the 13 EMA
Take Profit Strategies
- Target 1: 1:2 risk-to-reward ratio
- Target 2: Next major support/resistance level
- Trailing: Move stop loss to break-even after 1:1 ratio
How to set stop loss and take profit in MT4 becomes essential knowledge for implementing these levels properly.
VARIATIONS OF THE EMA STRATEGY
8,13,21 EMA Strategy
This four-EMA system adds extra confirmation:
- 5 EMA crossing all others signals strong momentum
- More filtering but potentially delayed entries
- Best for highly volatile pairs
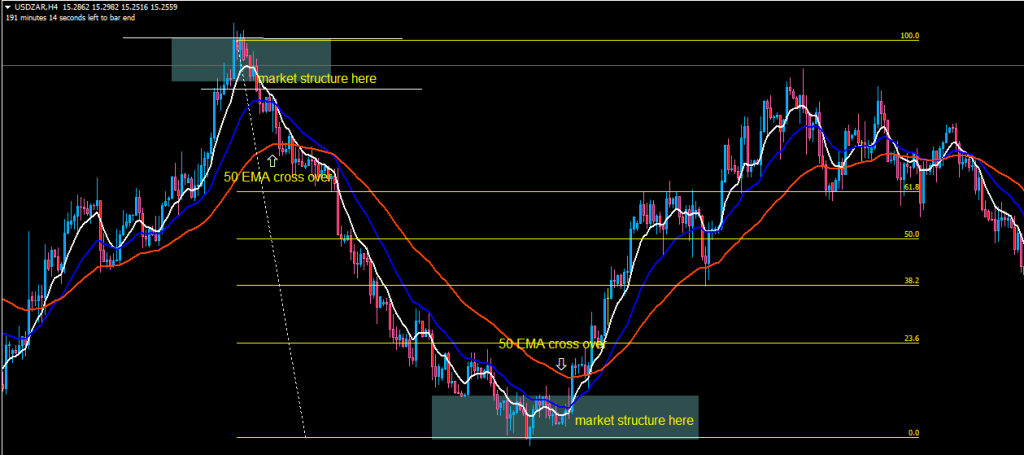
8,21,50 EMA Strategy
A longer-term approach where:
- 50 EMA acts as major support/resistance
- 8 EMA crossing signals trend continuation
- Fewer but higher-quality signals
3 Moving Average Crossover Strategies
Multiple combinations work, including:
- 8,13,21 (our focus)
- 5,10,20 for faster signals
- 10,20,50 for longer-term trends
COMMON MISTAKES TO AVOID
Trading Against Market Structure
Never take an EMA signal that goes against established market structure. This is the fastest way to lose money.
Ignoring Higher Timeframes
Always check higher timeframes for:
- Overall trend direction
- Major support/resistance levels
- Potential reversals
Over-Trading
Not every EMA crossover is tradeable. Wait for:
- Clear market structure
- Proper risk-to-reward setup
- Confirmation from other indicators
Poor Risk Management
Making money trading forex depends largely on how well you manage risk, not just on your strategy.
PRACTICAL EXAMPLE: TRADING GBP/USD
Let’s walk through a real scenario:
Setup: GBP/USD 4-hour chart shows:
- Clear uptrend structure (higher highs, higher lows)
- Price pulls back to test 21 EMA support
- 8 EMA preparing to cross above 13 EMA
Entry:

- Wait for 8 EMA to cross 13 EMA with bullish candle close
- Enter long position at market open of next candle
- Stop loss: 20 pips below 21 EMA
- Take profit: Next resistance level (100 pips away)
Result: Risk-to-reward ratio of 1:5, following proper money management principles.
OPTIMIZING YOUR EMA STRATEGY
Backtesting Results
Before risking real money:
- Test on historical data
- Track win rate and average returns
- Identify best-performing pairs and timeframes
- Document what works and what doesn’t
Pair Selection
Some currency pairs work better than others:
- Trending pairs: EUR/USD, GBP/USD, USD/JPY
- Avoid: Exotic pairs with erratic movements
- Best results: Major pairs during active sessions
Session Timing
Market sessions affect performance:
- London session: Best for EUR/GBP pairs
- New York session: Excellent for USD pairs
- Asian session: Often ranging, use caution
TECHNOLOGY AND TOOLS
MT4 Implementation
This profitable trading strategy using MT4 setup requires:
- Standard EMA indicator (built-in)
- Custom colours for easy identification
- Alert system for crossovers
- Proper chart templates for consistency
Mobile Trading
Modern forex trading happens on mobile:
- Set up alerts for EMA crossovers
- Use push notifications
- Keep charts simple and clean
- Practice entries on demo first
BUILDING YOUR TRADING PLAN
Daily Routine
- Check higher timeframe structure
- Identify potential setups
- Set alerts for EMA crossovers
- Review and adjust positions
Weekly Review
- Analyse winning and losing trades
- Identify improvement areas
- Adjust strategy if needed
- Plan for upcoming economic events
Monthly Assessment
- Calculate overall performance
- Compare to benchmarks
- Refine money management rules
- Set goals for next month
PSYCHOLOGY AND DISCIPLINE
Emotional Control
The 8,13,21 EMA strategy only works if you:
- Follow rules consistently
- Don’t chase trades
- Accept losses as part of business
- Stay patient during drawdowns
Building Confidence
- Start with demo trading
- Keep detailed trading journal
- Focus on process over profits
- Celebrate small wins
CONCLUSION: MASTERING THE 8,13,21 EMA STRATEGY
The 8,13,21 EMA strategy isn’t just another trading system it’s a comprehensive approach that combines simplicity with effectiveness.
When properly integrated with market structure analysis and solid risk management, it becomes a powerful tool for consistent forex profits.
Remember, no strategy works 100% of the time. Your success depends on discipline, proper execution, and continuous learning.
The exponential moving averages of 8, 13, and 21 provide the framework, but your skill and patience determine the results.
Start with demo trading, master the basics, and gradually increase your position sizes as confidence grows. The forex market rewards those who approach it with respect, preparation, and realistic expectations.
Ready to transform your trading? Download your free MT4 platform today and start practising this strategy on demo. Remember: every professional trader started exactly where you are now.


