Price action and market structure are two fantastic forex fundamental terms that every trader should be aware of.
It covers the concept of the market’s dominant trend as well as other fundamental trading principles such as support and resistance, chart patterns, and more.
Price action and market structure can occur at any time frame.
If you are a technical analysis trader, the above trading idea will pinpoint high-value areas for trigger entries if executed correctly.
You will understand the significance of these forex technical analysis trading after reading this article.
- WHAT IS PRICE ACTION IN FOREX
- PRICE ACTION AND MARKET STRUCTURE
- MASTERING MARKET STRUCTURE
- HOW DO YOU DETERMINE PRICE ACTION AND MARKET STRUCTURE
- PRICE ACTIONS BUY AND SELL SIGNAL
- PRICE ACTION SETUPS
- FOREX MARKET STRUCTURE PATTERNS
- DOUBLE TOP
- DOUBLE BOTTOM
- HEAD AND SHOULDERS
- INVERSE HEAD AND SHOULDERS
- BULLISH SYMMETRICAL TRIANGLE
- BEARISH SYMMETRICAL TRIANGLE
- BULLISH PENNANT
- BEARISH PENNANT
- BULLISH FLAG
- BEARISH FLAG
- CUP AND HANDLE
- INVERSE CUP AND HANDLE
- TRIPLE TOP
- TRIPLE BOTTOM
- FALLING WEDGES
- RISING WEDGES
- ASCENDING TRIANGLE
- DESCENDING TRIANGLE

WHAT IS PRICE ACTION IN FOREX
Price action is a complete naked trading system without the use of any indicators. Price action shows the real-time market price.
It can be seen across all financial markets as it requires candlesticks interpretation and the use of other trading default tools like Trend Line and Fibonacci.
Price action traders’ can analyze the current market condition and predict a possible outcome using previous highs and lows, support, and resistance.
These highs and low, support and resistance can act as a guide to where high-value triggers will be.
ADVANTAGES OF PRICE ACTION TRADING
- Price action trading shows real-time market data unlike lagging indicators
- Price action trading gives clear data on buyers’ and sellers’ behavior
- With price action trading a trader can easily spot the lows and the high
- Price action helps a trader know the dominant trend
- Price action trading marks areas for large market moves
DISADVANTAGES OF PRICE ACTION TRADING
- Does not support fundamental analysis
- Requires the use of other trading tools to confirm entries
- Works best on higher timeframes.
PRICE ACTION AND MARKET STRUCTURE
Price action and market structure can be defined as:
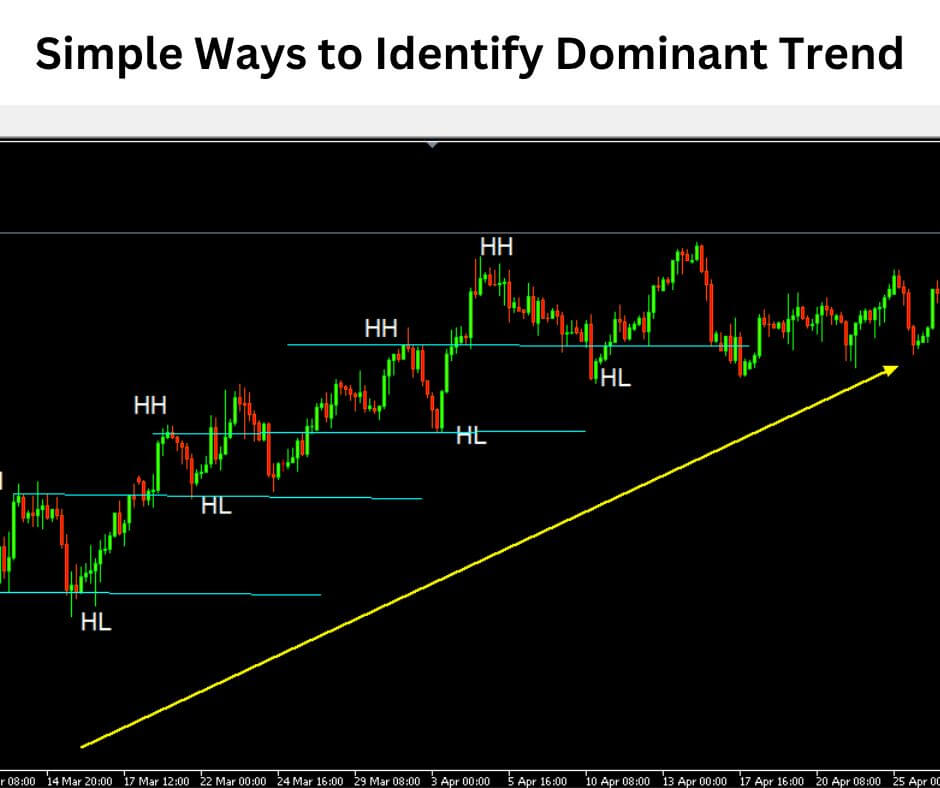
- The dominant trend of the market making higher highs and higher lows or lower low and lower highs.
- Support and resistance zones
- Chart pattern
- Candle stick pattern
- Order block
MASTERING MARKET STRUCTURE
Mastering market structure requires time and patience. One of the basics of mastering market structure is the ability to tell if a market is on an uptrend, downtrend, or range.
As a trader, if you can tell the above then you have solved 70% of the market analysis.
After that, you can then begin to use all the necessary tools needed to pinpoint high-value zones for entry.
Other tools that can be employed in mastering market structure are:
- Support and resistance
- Chart pattern
- Confluences
- Order block
Mastering market structure means bringing out all your cards to the table as this will enable you to make proper trade entry.
At the top of this article, you will find more detailed information regarding mastering market structure.
HOW DO YOU DETERMINE PRICE ACTION AND MARKET STRUCTURE
Determining market structure means identifying the dominant trend; to do this you need to know if the market is on an uptrend, downtrend, or ranging.
To determine market structure a trader will need to identify if the market is making higher highs and higher lows (uptrend) or lower lows and lower highs (downtrend) or a ranging market (between a high and low).
UPTREND
Uptrend is identified by price making higher highs and higher lows.
DOWNTREND
Downtrend is identified by price making lower lows and lower highs.
RANGING
A ranging market is a price fluctuating between a high and low price. It is also called a sideways market.
PRICE ACTIONS BUY AND SELL SIGNAL
For a price and action trading strategy to be complete, you need a buy and sell signal that confirms an entry.
These signals are best taken in high-value zones which are support and resistance zones.
Two examples of this price action buy and sell signal is the pin bar and the engulfing candle.
PIN BAR
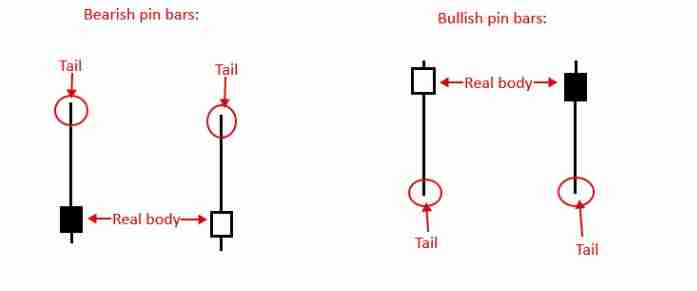
A pin bar is a candlestick reversal pattern that indicates that the market has rejected the price action at a specific zone. It is a common candle formation on Forex charts and it is one of the candlestick patterns formed by a single candle.
ENGULFING CANDLE
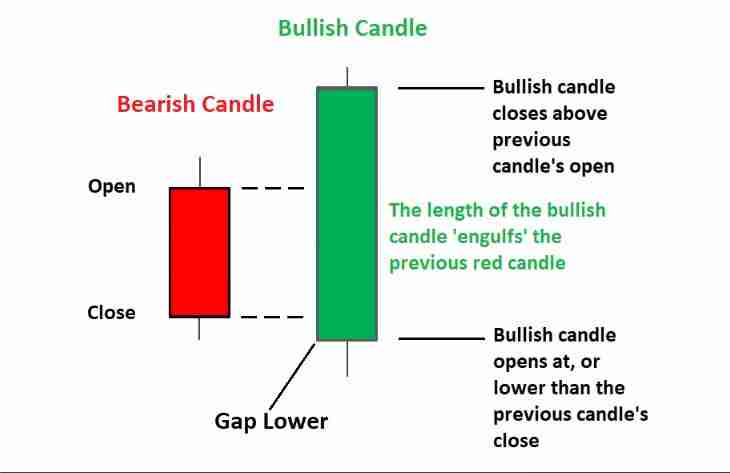
Engulfing candles typically indicate a reversal of the market’s current trend. This pattern consists of two candles, with the latter ‘engulfing’ the entire body of the candle before it.
Depending on where it forms the current trend, the engulfing candle can be bullish or bearish.
PRICE ACTION SETUPS
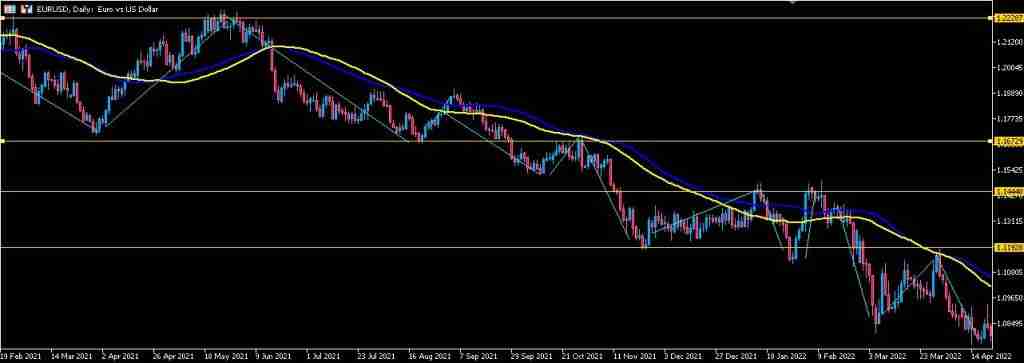
Price action setups are a trading strategy in which a trader focuses on high-value areas of the market while paying attention to basic market structure concepts such as higher highs and lower lows, support and resistance, and so on.
Price action setups are 100% naked chart trading without indicators, these setups can be seen across all time frames however the higher timeframes are more stable.
It is also possible to add one or two indicators as a secondary option to your naked chart when using price action.
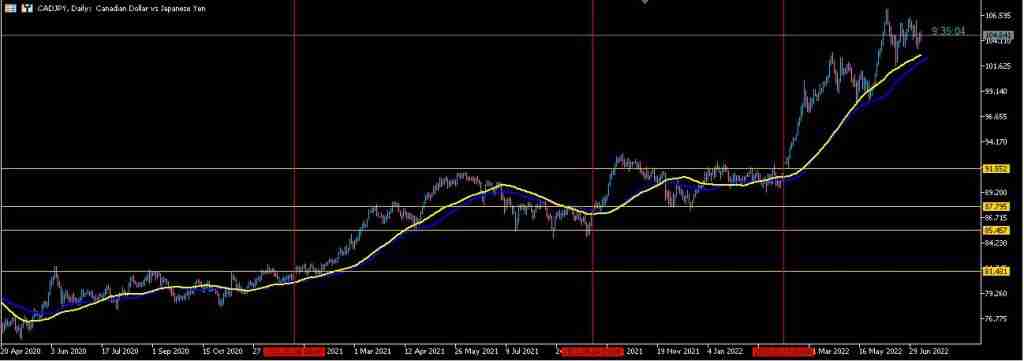
Below is an image illustration of a price action setup on the daily chart.
FOREX MARKET STRUCTURE PATTERNS
Forex market structure patterns simply utilize the concepts of higher highs, lower low, support, and resistance, chart patterns, and confluences are more.
The forex market structure pattern concept is the foundation of technical analysis trading. These structures and patterns are formed by traders’ buy and sell orders.
In this article, I am going to explain with image illustrations eleven important chart pattern structures every trader should know.
- Double top
- Double bottom
- Head and shoulders
- Symmetrical triangle
- Pennant and flags
- Cup and handle
- Triple top
- Triple Bottom
- Wedges
- Ascending triangle
- Descending triangle
DOUBLE TOP
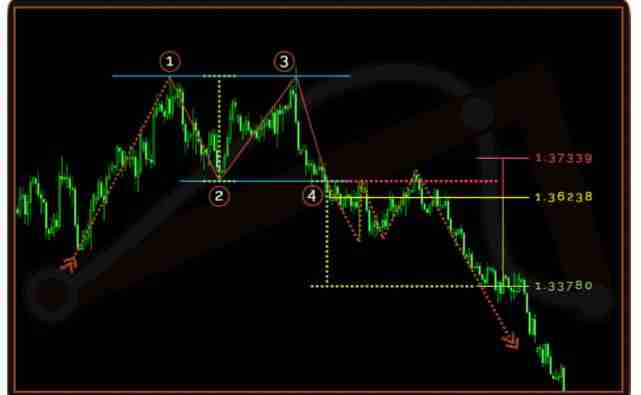
Price action in an uptrend first encounters resistance (1), after which it reverses direction and falls until it reaches support (2).
Price action reverses direction from (2) and moves upwards until it encounters the second resistance (3), which will be -roughly- at the same rate as the first resistance (1).
The pattern is complete when price action reverses direction from the second resistance (3) and falls until it reaches the lower support at point (4).
Direction: reversal chart pattern
Occurrence: high
Common term: medium to long
See the image illustration below: (Photo credit – tradingaxe.com/learn)
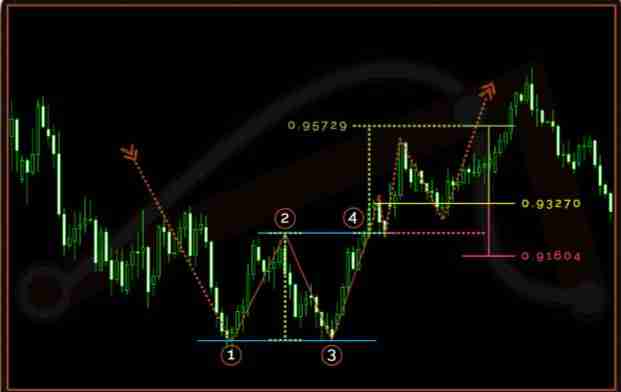
DOUBLE BOTTOM
In a downtrend, price action encounters first resistance (1), after which it reverses direction and moves upwards until it encounters support (2). (2).
Price action reverses direction from (2) and descends until it encounters second resistance (3), which will be -roughly- at the same rate as the first resistance (1).
The pattern is complete when price action reverses direction from the second resistance (3) and moves upwards until it breaks through the upper support at point (4).
Direction: reversal chart pattern
Occurrence: high
Common term: medium to long
See the image illustration below: (Photo credit – tradingaxe)
HEAD AND SHOULDERS
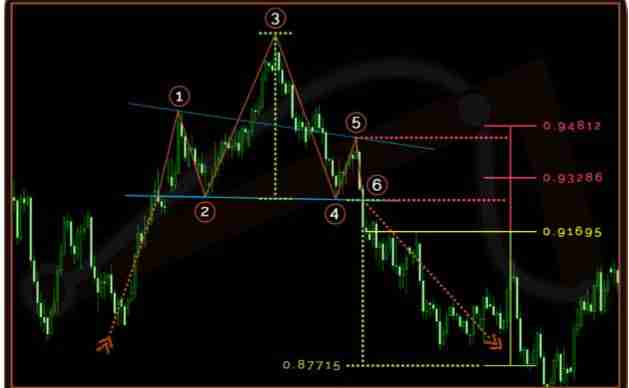
Price action in an uptrend first encounters resistance (1), forming the left shoulder’s high, after which it reverses and moves downward until it encounters support (2), completing the left shoulder formation. From that support (2), price action changes direction and moves upward until it encounters the second resistance (3), which creates the head’s high.
From there, price action changes direction again and moves downward until it encounters support (4), completing the head formation.
The price action changes direction from the previous support level (4) and moves upward until it encounters the third resistance level (5) that forms the right shoulder high, at which point it changes direction and moves lower.
When price action crosses the neckline at point (6) downward, the pattern is finished.
Direction: Reversal chart pattern
Occurrence: Low
Common term: medium to long
See the image illustration below: (Photo credit – tradingaxe)
INVERSE HEAD AND SHOULDERS
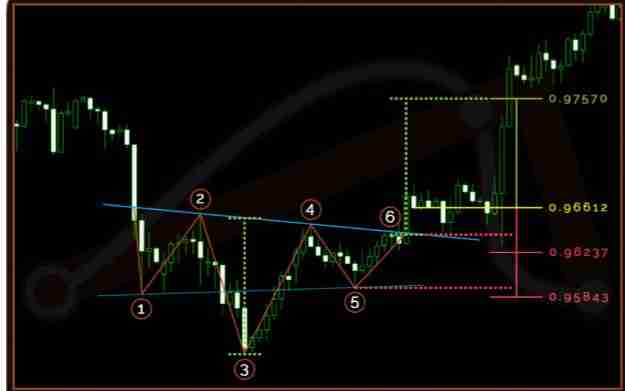
Price action in a downtrend first encounters resistance (1), creating the left shoulder’s low, after which it reverses and moves upward until encountering support (2), completing the left shoulder formation.
From that support (2), price action changes direction and moves downward until encountering second resistance (3), which creates the head’s low.
From there, price action changes direction and moves upward until encountering support (4), completing the head formation.
The price action changes direction from the previous support point (4) and moves downward until it encounters the third resistance point (5), which forms the right shoulder low, at which point it changes direction and moves upward.
When price action crosses the upward-facing neckline at point (6), the pattern is finished.
Direction: reversal
Occurrence: low
Common term: medium to long
See the image illustration below:
BULLISH SYMMETRICAL TRIANGLE
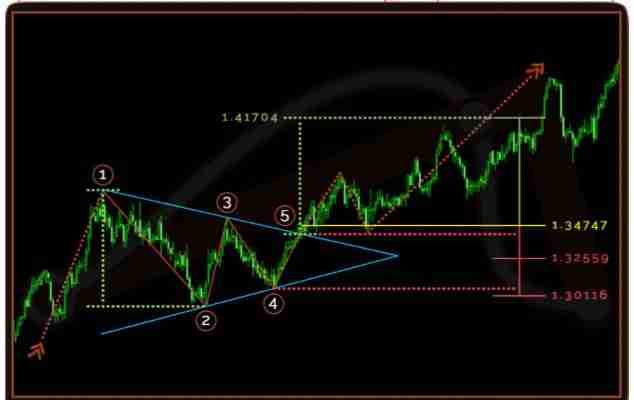
In an uptrend, price action encounters first resistance (1), which corresponds to the pattern’s highest high, after which it reverses course and moves downward until encountering first support (2), which corresponds to the pattern’s lowest low.
The price action reversed from the support level (2), moving upward until it encountered the second resistance level (3), which had to be lower than the first resistance (1).
The price action reversed from the resistance point (3) and descended until it reached the second support, which had to be higher than the first support (2).
The pattern is complete when price action changes direction from step four and moves upward until it breaks the upper border of the triangle at step five (5).
Direction: continuation
Occurrence: high
Common term: medium to long
See the image illustration below: (Photo credit – tradingaxe)
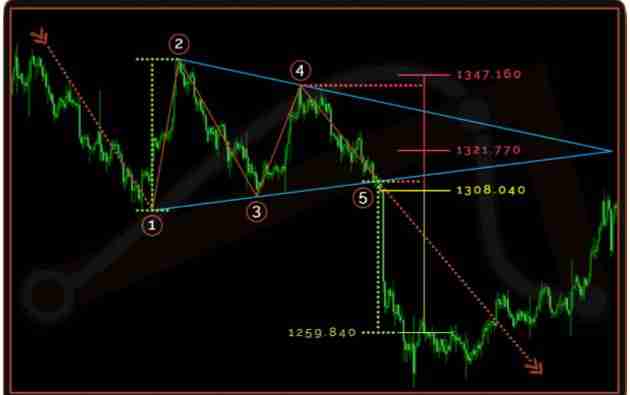
BEARISH SYMMETRICAL TRIANGLE
In a downtrend, price action encounters first resistance (1), which corresponds to the pattern’s lowest low, after which it reverses course and moves upward until encountering first support (2), which corresponds to the pattern’s highest high.
After finding the second resistance (3), which must be higher than the first resistance, price action reversed direction from the support (2). (1).
Price action reversed from the resistance point (3) and moved upward before reaching the second support, which had to be lower than the first support (2).
The pattern is finished when price action changes direction from step (4) and descends until it breaks the lower border of the triangle at step point (5).
Direction: continuation
Occurrence: high
Common term: medium to long
See the image illustration below: (Photo credit – tradingaxe)
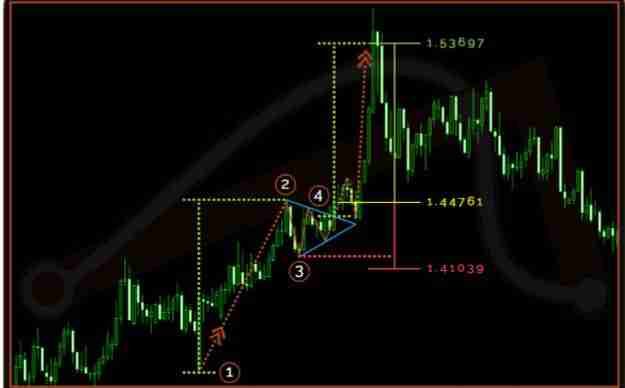
BULLISH PENNANT
A steep upward price action begins from (1) and continues until it meets the first resistance (2), forming the pennant’s pole. Price action reverses direction from (2) and falls until it reaches first support (3).
Price action oscillates between (2 and 3) ranges, resulting in lower high(s) and a higher low(s) (s).
The pattern is complete when price action reverses direction from the last touch to the lower pennant border and moves upwards until it breaks through the upper border at point (4).
Direction: Continuation
Occurrence: High
Common term: Short to Medium
See the image illustration below:
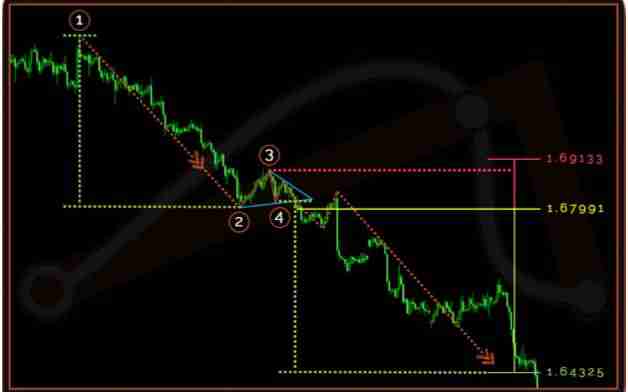
BEARISH PENNANT
A steep downward price action begins from (1) and continues until it meets the first resistance (2), forming the pennant’s pole. Price action reverses direction from (2) and rises until it reaches first support (3).
Price action oscillates between (2 and 3) ranges, resulting in lower high(s) and a higher low(s) (s).
The pattern is complete when price action reverses direction from the last touch to the upper pennant border and falls until it reaches the lower border at point (4).
Direction: Continuation
Occurrence: High
Common term: Short to Medium
See the image illustration below: (Photo credit – tradingaxe)
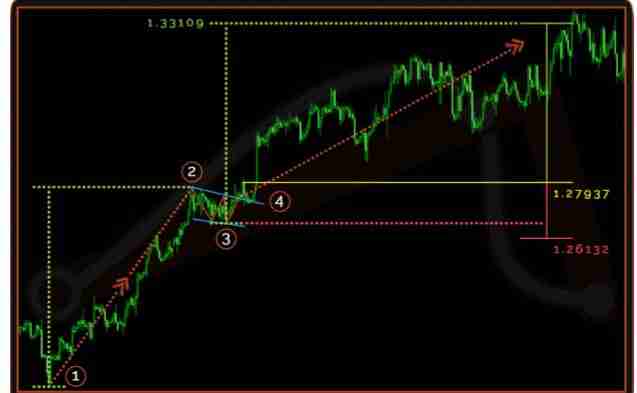
BULLISH FLAG
A steep upward price action begins from (1) and continues until it meets the first resistance (2), forming the flag’s pole.
Price action reverses direction from (2) and forms lower highs and lower lows in a narrow flag formation until it reaches the formation’s lowest support at point (3).
The pattern is complete when price action reverses direction from the last touch to the lower flag border and moves upwards until it reaches the upper flag border at point (4).
Direction: Continuation
Occurrence: High
Common term: Short to Medium
See the image illustration below: Photo credit – tradingaxe
BEARISH FLAG
A steep downward price action begins from (1) and continues until it meets the first resistance (2), forming the flag’s pole.
Price action reverses direction from (2) and forms higher lows and higher highs in a narrow flag formation until it reaches the formation’s highest support at point (3).
The pattern is complete when price action reverses direction from the last touch to the upper flag border and falls until it reaches the lower border at point (4).
Direction: Continuation
Occurrence: High
Common term: Short to Medium
See the image illustration below: (Photo credit – tradingaxe)
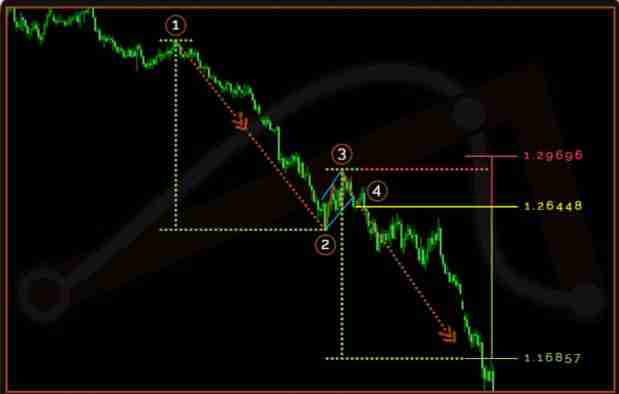
CUP AND HANDLE
In an uptrend, price action encounters first resistance (1), after which it reverses direction and proceeds steadily downwards until it encounters first support (2), which is the pattern’s lowest low.
Price action reverses direction from support (2) and continues to rise steadily until it reaches the second resistance (3), completing the cup formation.
The price action reverses direction from the resistance (3) and falls until it reaches the second support (4), which must be higher than the first support (2).
The pattern is complete when the price action reverses direction from (4) and rises until it breaks the cup and handle surface at point (5).
Direction: Continuation
Occurrence: Low
Common term: Long
See the image illustration below: Photo credit – tradingaxe)
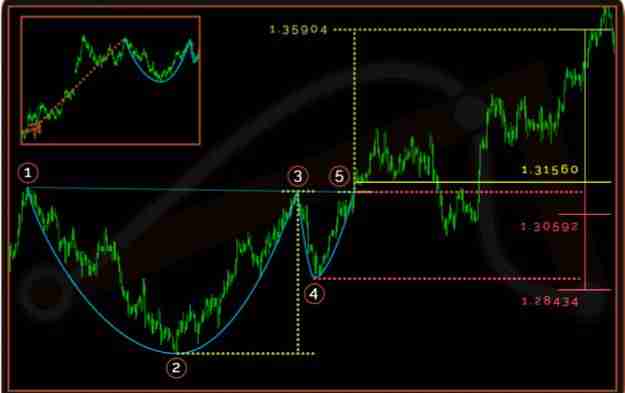
INVERSE CUP AND HANDLE
In a downtrend, price action encounters first resistance (1), after which it reverses direction and steadily ascends until it encounters first support (2), which is the highest high in the pattern.
Price action reverses direction from support (2) and continues to fall until it reaches the second resistance (3) and completes the cup formation.
Price action reverses direction from resistance (3) and ascends until it reaches the second support (4), which must be lower than the first support (2).
The pattern is complete when the price action reverses direction from (4) and falls until it breaks the cup and handles the surface at point (5).
Direction: Continuation
Occurrence: Low
Common term: Long
See the image illustration below:
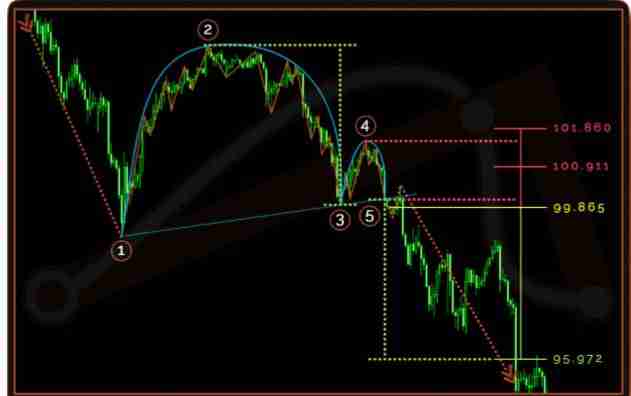
TRIPLE TOP
Price action in an uptrend first encounters resistance (1), after which it reverses direction and falls until it reaches support (2).
Price action reverses direction from (2) and moves upwards until it encounters the second resistance (3), which will be -roughly- at the same rate as the first resistance (1).
Price action reverses direction from (3) and descends until it reaches second support (4), which can be higher or lower than the first support (2).
Price action reverses direction from (4) and moves upwards until it encounters third resistance (5), which will be -around- the same rate as the first (1) and second (3) resistances.
The pattern is complete when price action reverses direction from the third resistance (5) and falls below the lower
Support at point 6.
Direction: Reversal
Occurrence: Low
Common term: Medium to Long
See the image illustration below:
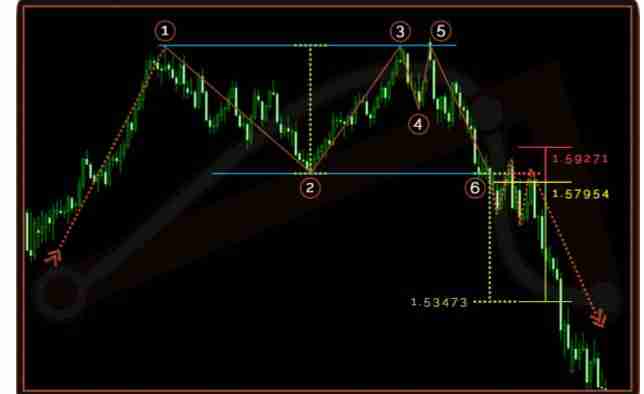
TRIPLE BOTTOM
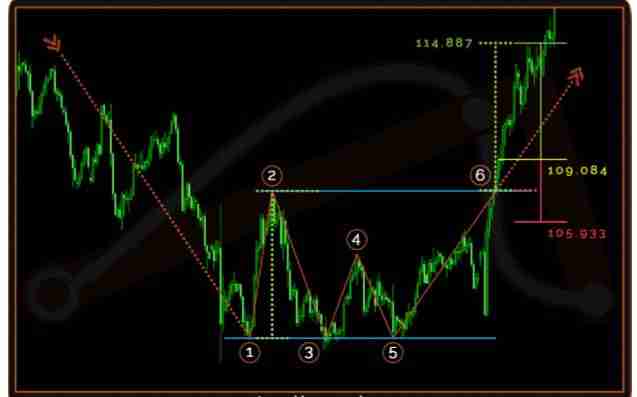
In a downtrend, price action encounters first resistance (1), after which it reverses direction and moves upwards until it encounters support (2). (2).
Price action reverses direction from (2) and descends until it encounters second resistance (3), which will be -roughly- at the same rate as the first resistance (1).
Price action reverses direction from (3) and ascends until it reaches second support (4), which can be higher or lower than the first support (2).
Price action reverses direction from (4) and falls until it reaches the third resistance (5), which will be -around- the same rate as both the first (1) and second (3) resistances.
The pattern is complete when price action reverses direction from the third resistance (5) and moves upwards until it breaks through the upper support at point 6.
Direction: Reversal
Occurrence: Low
Common term: Medium to Long
See the image illustration below: Photo credit – tradingaxe
FALLING WEDGES
Wedges are neutral patterns; they can be a reversal or a continuation, so the trend preceding the pattern formation is irrelevant.
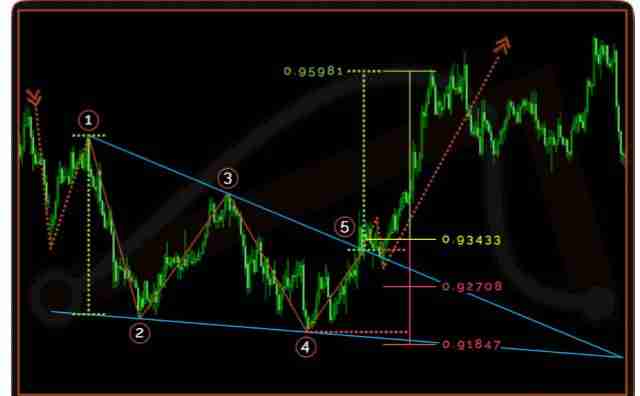
Because the falling wedge is a bullish pattern, all touches to the wedge’s upper border will be referred to as resistance, and all touches to the wedge’s lower border will be referred to as support.
Price action meets first resistance (1), then reverses direction and falls to first support (2).
Price action reverses direction from support (2) and rises until it reaches the second resistance (3), which must be lower than the first resistance (1).
The price action reverses direction from the resistance (3) and descends until it reaches the second support (4), which must be lower than the first support (2).
The pattern is complete when price action reverses direction from (4) and moves upwards until it reaches the upper border of the wedge at point (5).
Direction: Neutral
Occurrence: Medium
Common term: Medium to Long
See the image illustration below:
RISING WEDGES
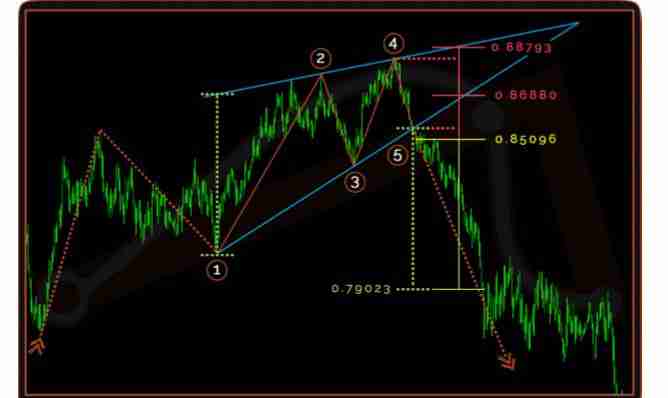
Price action encounters first resistance (1), then reverses direction and moves upwards until it encounters first support (2).
Price action reverses direction from support (2) and falls until it reaches the second resistance (3), which must be higher than the first resistance (1).
Price action reverses direction from resistance (3) and moves upwards until it reaches the second support (4), which must be higher than the first support (2).
The pattern is completed when price action reverses direction from (4) and moves downward until it reaches the lower border of the wedge at point (5).
Direction: Neutral
Occurrence: Medium
Common term: Medium to Long
See the image illustration below:
ASCENDING TRIANGLE
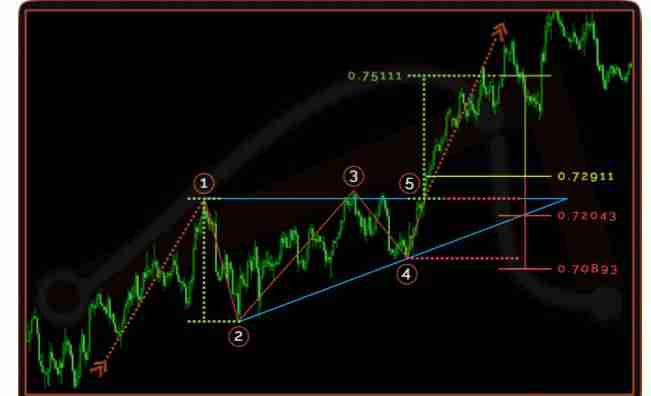
In an uptrend, price action encounters first resistance (1), which serves as horizontal resistance for the remainder of the pattern formation, before reversing direction and descending to first support (2), which serves as the pattern’s lowest low.
Price action reverses direction from support (2) and ascends until it reaches the second resistance (3), which will be -around- the same rate as the first resistance (1).
The price action reverses direction from the resistance (3) and falls until it reaches the second support (4), which must be higher than the first support (2).
The pattern is completed when price action reverses direction from (4) and moves upwards until it reaches the upper horizontal border of the triangle at point (5).
Direction: Continuation
Occurrence: Medium
Common term: Medium to Long
See the image below for illustration: (Photo credit – tradingaxe.com)
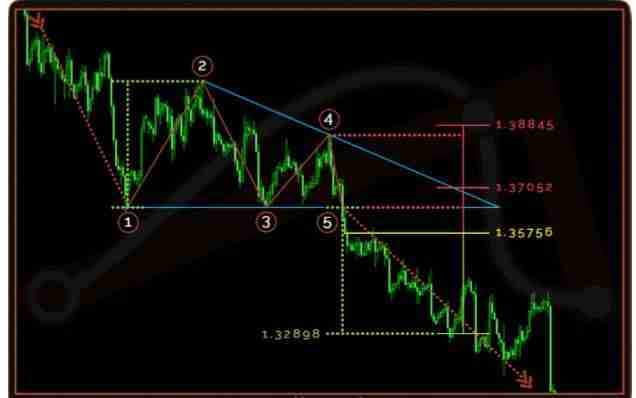
DESCENDING TRIANGLE
In a downtrend, price action encounters first resistance (1), which serves as horizontal resistance for the remainder of the pattern formation, before reversing direction and ascending to first support (2), which serves as the pattern’s highest high.
Price action reverses direction from support (2) and falls until it reaches the second resistance (3), which will be -roughly- at the same rate as the first resistance (1).
Price action reverses direction from resistance (3) and ascends until it reaches the second support (4), which must be lower than the first support (2).
The pattern is completed when price action reverses direction from (4) and moves downward until it reaches the lower horizontal border of the triangle at point (5).
Direction: Continuation
Occurrence: Medium
Common term: Medium to Long
See the images below for illustration: (Photo credit – tradingaxe)
