In this post, our focus will be on step by step guide on swing trading entry exit strategies. Pay attention as these simple tips will increase your trading profitability.
Every trading strategy should have an entry and exit plan; as simple as this sounds, many traders don’t take this seriously, and this is why they keep losing money.
Entry and exit techniques are critical to developing a profitable trading strategy, whether you’re trading forex, synthetics, or cryptocurrencies.
Your entry-exit strategies should be used in conjunction with your overall trading strategy to ensure that you are employing proper risk management in your trading.
Both combined will help you be disciplined and stick to your trading plan without letting your emotions affect your trading decisions.

SWING TRADING ENTRY EXIT STRATEGIES
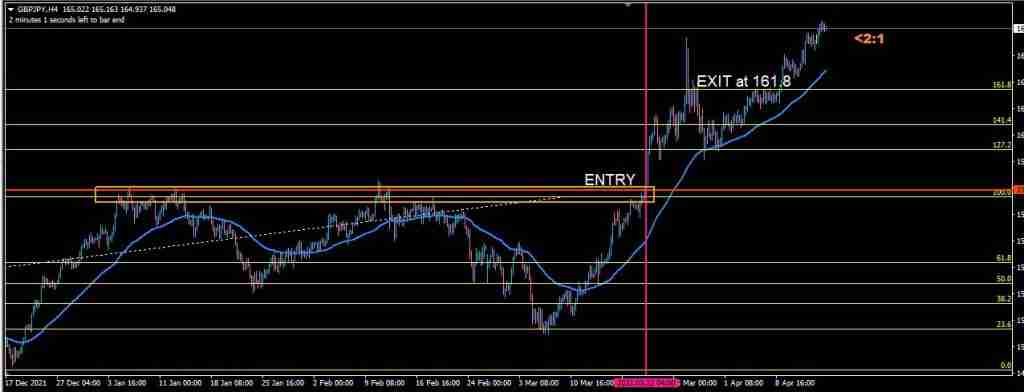
Below are the two(2) methods for an effective Swing trading entry and exit strategy:
FOR ENTRY STRATEGY
- For a potential entry, the price has to first reach a swing high or low on D1 (possibly a previous swing)
- A clear price rejection on that zone (rejection after a long trend on D1)
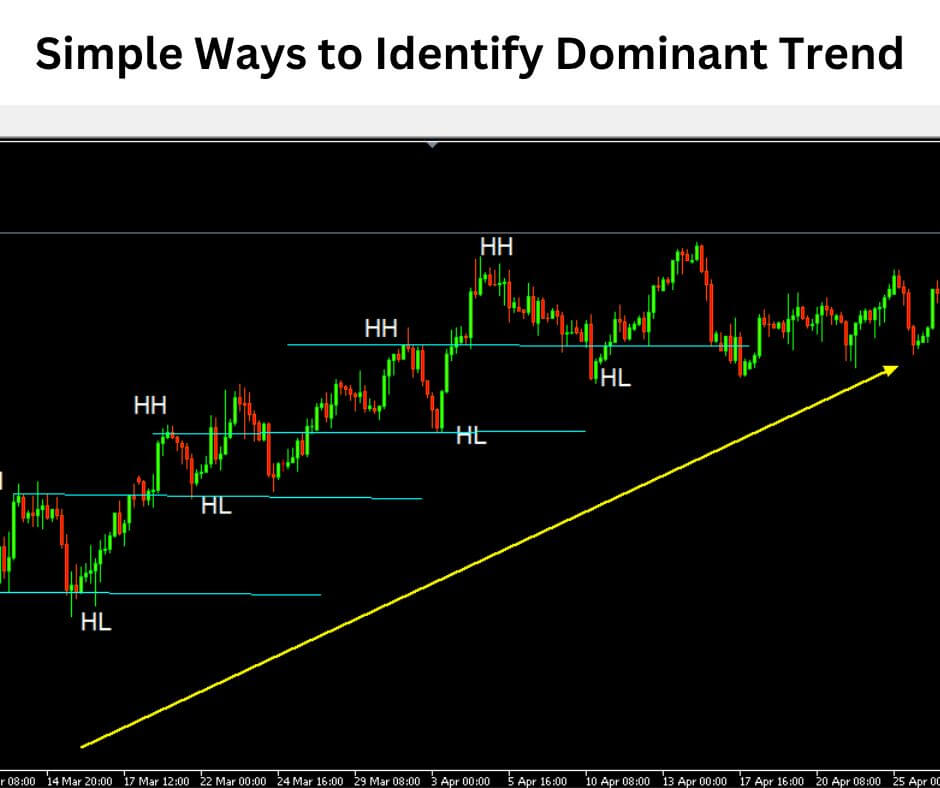
- Let’s imagine the rejection happens on a downtrend- apply multi-timeframe top-down analysis- identify a chart pattern, or trend line and horizontal break out on a lower timeframe H4/H1 making higher lows.
- On the breakout of the confluence horizontal line and trend line with a close of the candle, place your entry or wait for a retest.
FOR EXIT STRATEGY
There are three ways:
- You can exit at the most recent Resistance on H4 or D1
- You can exit on a reversal zone using your Fibonacci tool (reversal zone 127.2, 141.4, and 161.8.- read more on the Fibonacci tool in my other posts)
- You can measure the length of the previous bullish move using a trend line tool; use that to get the exit point of the bullish move entry.
READ ALSO: SCALPING VS DAY TRADING
READ ALSO: 5 MINUTE SCALPING STRATEGY
READ ALSO: HOW TO KNOW WHEN A TREND IS ENDING?
HOW TO IDENTIFY ENTRY AND EXIT POINTS FOR SWING TRADING
A trader can only be as good as his/her ability to identify entry and exit points in a trade.
A trader’s understanding of forex market structure and price action gives a clearer perspective of when to enter and exit a trade.
There is more than one way to identify entry and exit points in a market and in this post, I am going to be listing a few.
Before I list them, I want you to note that entry and exit levels are best taken in supply and demand zones or major support and resistance areas.
DOUBLE BOTTOM
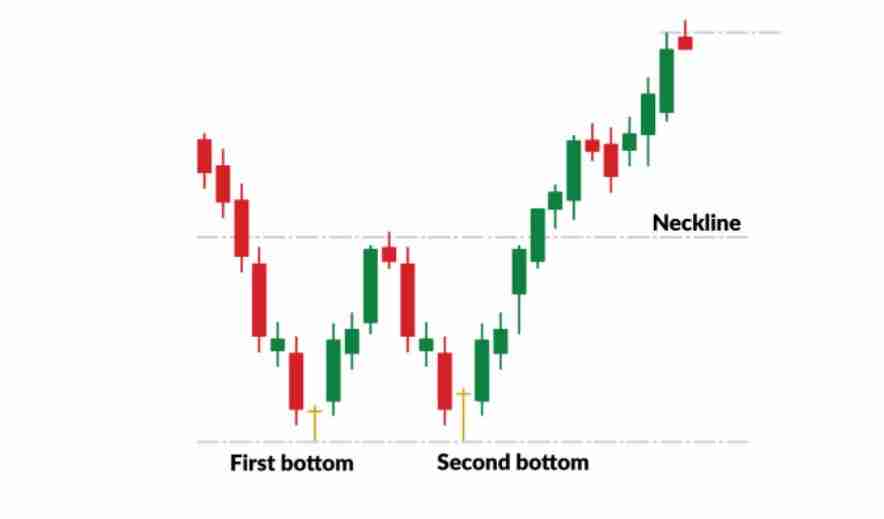
The double bottom is a trend reversal chart pattern that could signal a change in momentum from previous major price movements. This happens after a long bearish trend.
The double bottom pattern shows the start of a possible uptrend reversal.
The rise in trading volume of the double bottom pattern shows a strong indicator of upward pressure and improves the likelihood of a successful double bottom.
How to identify a double-bottom
The lower value at the bottom of W works as a support level and the double bottom resembles the letter “W.”
Sometimes it creates a skewed W with the right bottom forming a higher low.
BULLISH FLAG
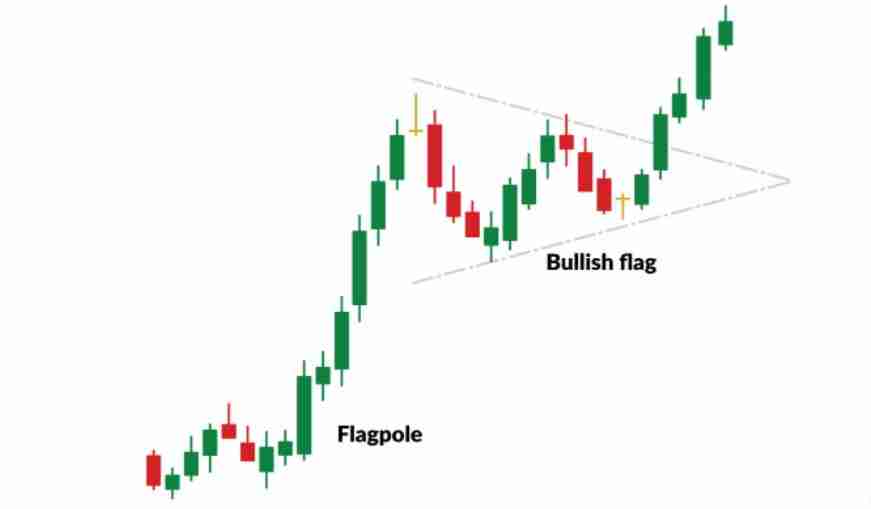
A flag pattern is a continuation chart pattern that signals a sharp reverse trend
HOW TO IDENTIFY A FLAG
A flag can be seen on a bullish or bearish trend, it is a slight pause in trend, giving the formation of a flag and a long pole either from the top or bottom.
The flag usually has an M or W shape inside the flat pattern. It signals an entry when it breaks out of the pattern.
HEAD AND SHOULDER
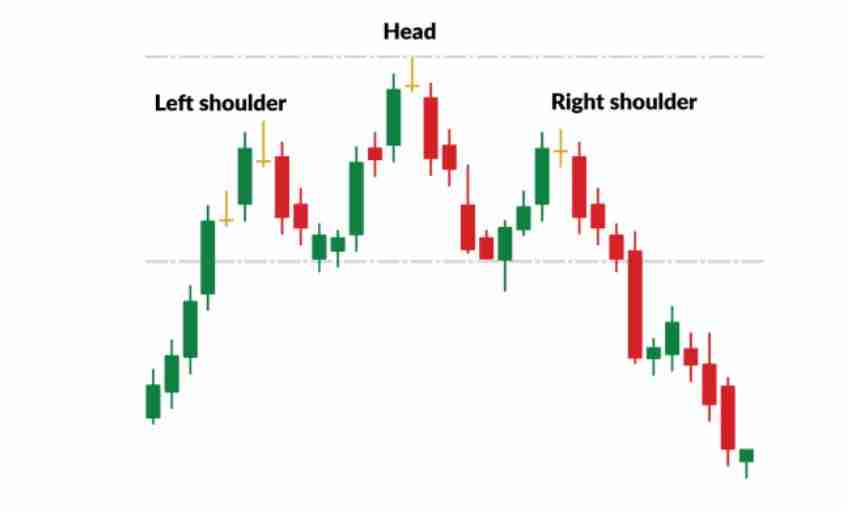
The Head and shoulder reversal chart pattern contains three peaks: the outer two (shoulders) can be the same height or skewed, but the center which is the head is higher.
To get a full free PDF of how to identify entry and exit points, kindly see the Asia Forex Mentor Forex patterns pdf guide.
In the above PDF, you will learn how to enter and exit a trade in Forex.
PRICE ACTION ENTRY AND EXIT STRATEGY
To know price action, market structure, and exit strategy you must first know what price action is.
Price action is the analysis of an index’s, commodities, or currencies’ performance to forecast what will happen in the future.
To understand the general market structure, traders need to look at patterns and identify key chart patterns, support and resistance levels, and indicators that can cause a significant change in the overall market direction.
Many traders utilize a variety of price action tactics to predict market moves and profit in the near term.
Price action is purely naked trading, with the absence of fancy indicators.
Below are the top 5 PRICE ACTION ENTRY AND EXIT STRATEGY:
- PIN BAR
The pin bar pattern is symbolic of a candle with a long wick. It depicts a sudden price reversal and rejection, with the ‘wick’ or tail indicating the price range that was rejected.
The idea is that the price will continue to move in the opposite direction of the tail, and traders will use this information to decide whether to go long or short.
- TREND CONTINUATION BREAKOUT ENTRY
This trend follows any large market moves, assuming that a price surge would be followed by a correction. A breakout occurs when a market goes outside of a designated support or resistance level.
This breakout signals an entry for the trader to buy or sell depending on the dominant trend breakout.
- THE HIGHER HIGH/LOWER LOW CONCEPT
Price action trading is essentially a concept of highs and lows. Traders who use price action strategy can spot new market trends just at the beginning when they begin to happen.
For instance, if a price is trading at higher highs and higher lows, it is signaling an uptrend. It’s moving downward if it’s trading at lower highs and lows.
Traders can choose an entry point at the lower end of an upward trend and set a stop just before the previous higher low by using their understanding of highs and low cycles.
- INSIDE BAR
An inside bar pattern is a two-bar approach in which the inner bar is smaller than the outer bar and lies between the outer bar’s high and low range.
Inside bars commonly appear during a period of market consolidation, but they can also serve as a red flag, signifying a market change in trend.
Experienced traders should be able to identify this trend at a glance and use their market structure knowledge to determine whether the inner bar signals market consolidation or a reversal in the current market trend.
The size and position of the inside bar will define if a price will go higher or lower.
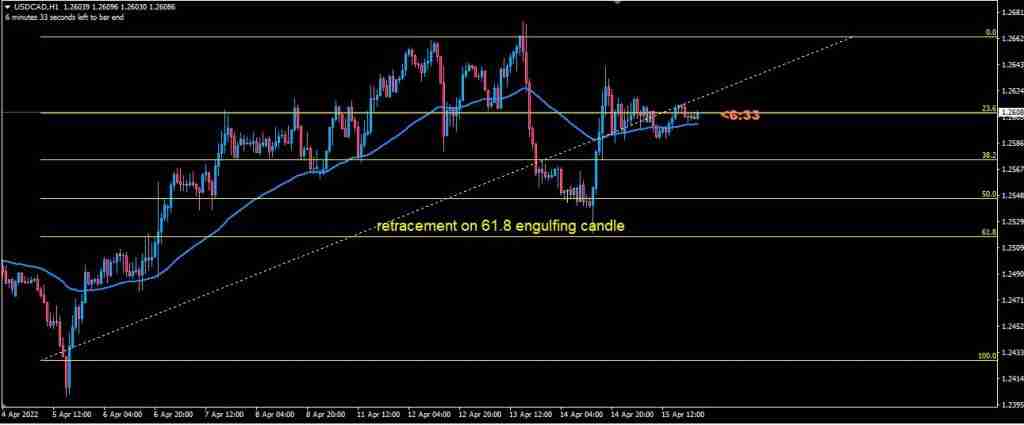
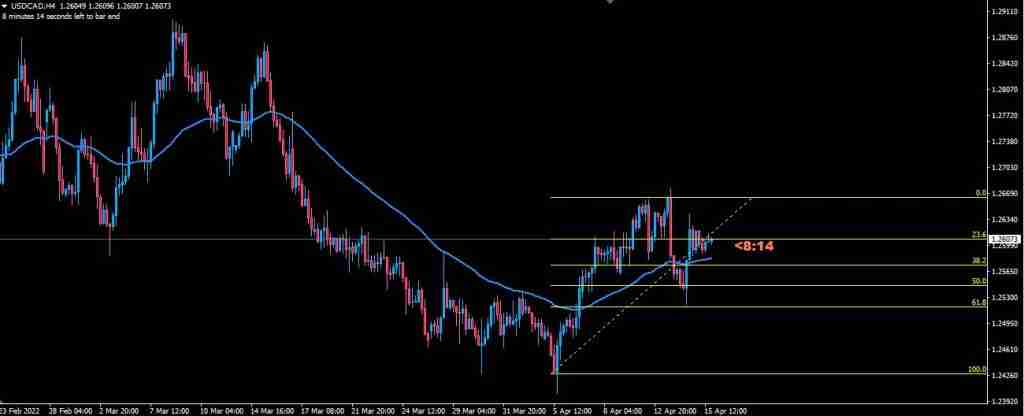
- PRICE RETRACEMENT ENTRY AFTERMARKET IMPULSE
This is one of the simplest strategies where the trader simply identifies the dominant trend and enters the retracement (can use Fibonacci retrace zones- 38.2, 50.0, 61.8)
A trader can apply an engulfing candle strategy on a lower timeframe H1 for entry.
See the Images below:
WHEN SHOULD I EXIT A SWING TRADE?
If you have been in the forex market for a while, you would know that there are no perfect strategies, sometimes swing trades fail, and this is why as a trader you must apply risk management putting into consideration how much you can afford to lose per trade.
Every swing trader should have specific rules for their entry and exit. For instance, if you are using a reversal chart pattern for entry then the pattern fails then it’s time to exit your trade.
In a swing trade, you can also use your Fibonacci tool to identify points of exit (reversal zones).


Many thanks for the wonderful contents here.
Could you please share a simple trading strategy for boom and crash? Thanks for your understanding.
Hello Igah, sorry for the late reply. To learn more about boom and crash strategy, kindly go to our Youtube Channel: https://www.youtube.com/channel/UC6zAEsjNXwEJet88U-4swig