You’re scrolling through your trading platform at 2 AM, watching those dramatic spikes on Boom and Crash indices, wondering if there’s a secret formula that separates the winners from the losers.
Well, you’re not alone, thousands of traders worldwide are captivated by these synthetic indices, drawn like moths to a flame by their explosive movements and potential for quick profits.
Unlike traditional forex pairs that dance to the rhythm of economic news and central bank decisions, Boom and Crash indices march to their own beat.
They’re pure technical beasts, unaffected by whether the Bank of England raises rates or if the latest GDP figures disappoint.
This makes them both fascinating and frustrating in equal measure—especially when you’re trying to figure out how to trade Boom and Crash profitably.
Here’s the thing though most traders approach these indices with the same tired strategies they’d use on EUR/USD, and that’s where they go wrong.
But what if I told you there’s a methodical approach, a top secret on how to trade Boom and Crash that transforms chaotic price movements into readable patterns?
What if the key isn’t in the latest indicator or signal service, but in understanding something far more fundamental about how to trade Boom and Crash successfully?
- THE FOUNDATION: UNDERSTANDING MARKET STRUCTURE
- MARKET STRUCTURE ANALYSIS: THE GAME CHANGER
- MASTERING BOOM AND CRASH TRADING: ADVANCED STRATEGIES
- TRADING BOOM AND CRASH WITH $10: MAKING SMALL ACCOUNTS WORK
- CHART PATTERNS AND TECHNICAL ANALYSIS
- TIME MANAGEMENT AND SESSION ANALYSIS
- PRICE ACTION: THE UNIVERSAL LANGUAGE
- RISK MANAGEMENT: YOUR TRADING LIFELINE
- IS BOOM AND CRASH PROFITABLE?
- ADVANCED CONCEPTS
- TOOLS AND RESOURCES
- CONCLUSION: YOUR PATH TO MASTERY
THE FOUNDATION: UNDERSTANDING MARKET STRUCTURE
Before we dive into the nitty-gritty of catching those coveted spikes, let’s establish the bedrock principle that separates profitable traders from the rest.
The top secret on how to trade Boom and Crash isn’t hidden in some complex algorithm or exclusive indicator it’s rooted in mastering market structure.
Think of market structure as the DNA of price movement. Every chart tells a story, and that story unfolds through higher highs, lower lows, and the critical moments when these patterns break.
Whether you’re trading Boom 1000 or Crash 500, the market leaves breadcrumbs that reveal its next move.
The Three Pillars of Market Structure Analysis
1. Higher Timeframe Analysis:
Your trading journey begins not with the frantic 1-minute charts, but with the steady, reliable higher timeframes.
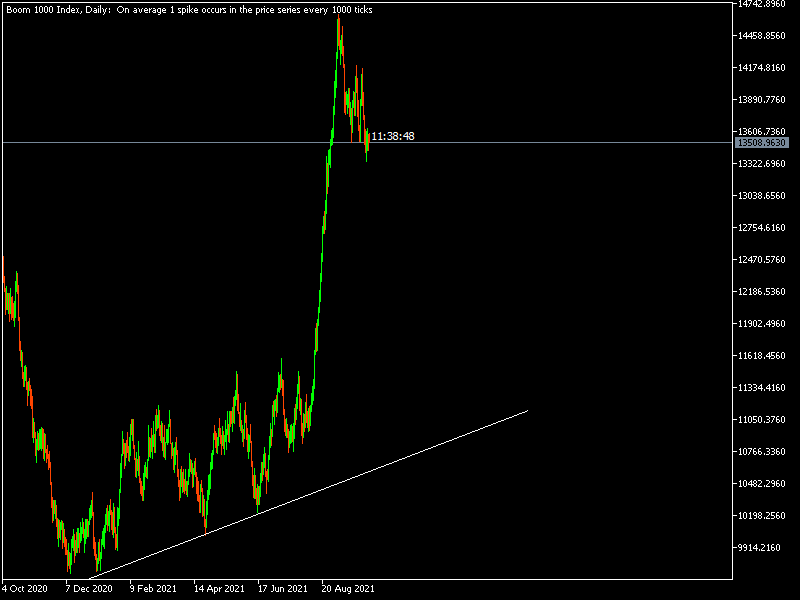
The D1 (daily) chart is your North Star, showing you the market’s true intentions. It’s here that you’ll spot the dominant trend, identify key support and resistance levels, and understand the bigger picture that smaller timeframes often obscure.
2. Top-Down Analysis:
This is where the magic happens. You start from the monthly chart, work your way down to weekly, then daily, and finally to your execution timeframe.
It’s like reading a book you wouldn’t start from the middle of a chapter and expect to understand the plot. Each timeframe provides context for the next, creating a comprehensive view of market sentiment.
3. Break of Structure Entry:
The moment of truth arrives when the market structure breaks. This isn’t just any random breakout—it’s a calculated move that aligns with your higher timeframe analysis.
When you see a break of structure that confirms your directional bias, that’s your green light for entry.
MARKET STRUCTURE ANALYSIS: THE GAME CHANGER
Market structure analysis isn’t just a fancy term it’s your roadmap to consistent profitability. When you understand how to read structure formations, you’re essentially decoding the market’s language.
These formations appear across all timeframes, but their significance amplifies on higher timeframes.
The beauty of Boom and Crash indices lies in their respect for technical analysis.
Unlike traditional markets that might gap due to overnight news, these synthetic indices maintain their structural integrity, making them perfect laboratories for technical traders.
Identifying Key Structural Elements
Support and Resistance Levels:
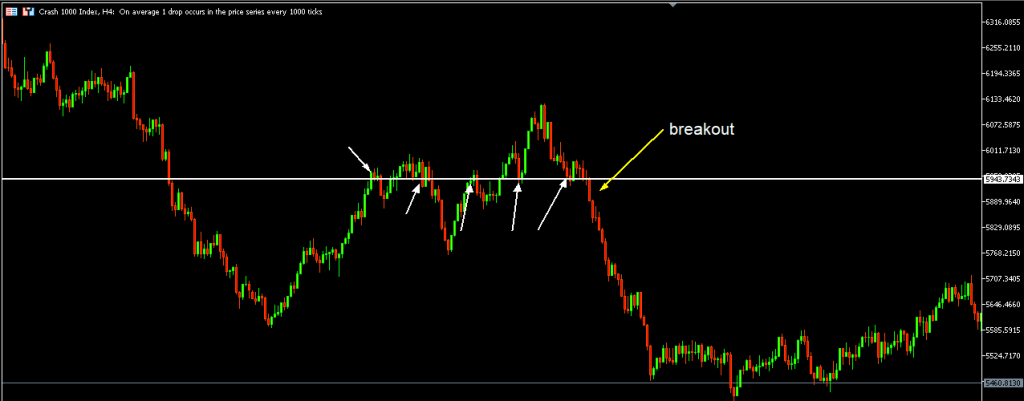
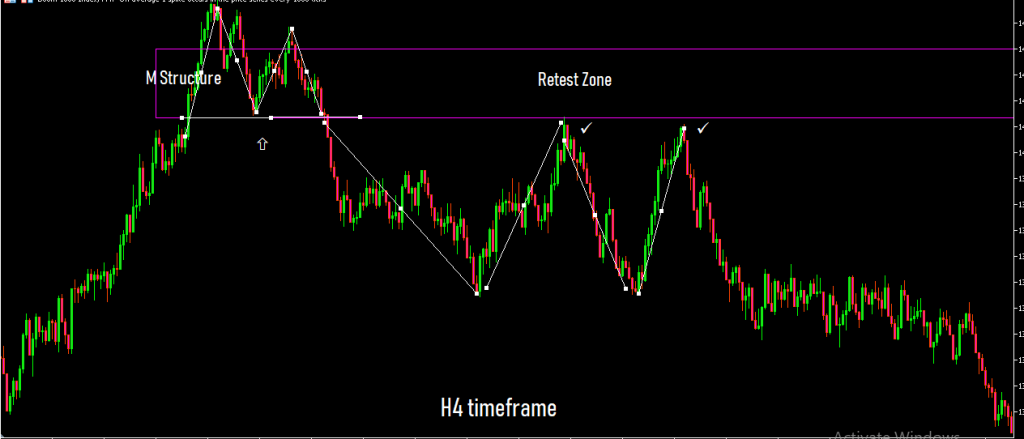
These aren’t just random lines on your chart they’re battlegrounds where bulls and bears clash. On Boom and Crash indices, these levels often cluster in multiple areas, creating what we call “zones of interest.”
When price approaches these zones, especially after a period of consolidation, the probability of a significant move increases dramatically.
Order Blocks:
These are institutional footprints left in the market. An order block represents an area where large orders were executed, creating imbalances that price must eventually address.
On synthetic indices, these blocks often serve as launching pads for major moves.
Supply and Demand Zones:
Think of these as the market’s breathing spaces. Demand zones are areas where buying pressure overwhelmed selling pressure, while supply zones represent the opposite.
When price returns to these zones, they often act as dynamic support or resistance levels.

MASTERING BOOM AND CRASH TRADING: ADVANCED STRATEGIES

Now that we’ve established the foundation, let’s explore the advanced strategies that separate amateur traders from professionals.
Mastering Boom and Crash trading requires more than just understanding basic concepts—it demands a sophisticated approach to market timing and risk management.
The Spike Strategy: Your Secret Weapon

Trading Boom and Crash spikes is an art form that combines technical precision with psychological fortitude. Spikes don’t occur randomly—they’re the result of accumulated pressure being released at critical structural levels.
The Spike Setup Process:
- Identify the Dominant Trend: Start with your D1 chart and determine whether the market is in an uptrend, downtrend, or range-bound condition.
- Map Multiple Support and Resistance Levels: These are your zones of interest where spikes are most likely to occur.
- Wait for Structure Breakout: This is where patience becomes your greatest ally. The market will telegraph its intentions through structure formation and eventual breakout.
- Execute with Precision: When all conditions align, execute your trade with predetermined risk parameters.
| Criteria | Boom Index | Crash Index |
| Trend Direction | Bullish bias preferred | Bearish bias preferred |
| Entry Signal | Break above resistance | Break below support |
| Stop Loss | Below recent swing low | Above recent swing high |
| Target | Next resistance level | Next support level |
| Risk/Reward | Minimum 1:2 ratio | Minimum 1:2 ratio |

The Power of Patience in Boom and Crash Trading
Here’s where most traders stumble they lack patience. The market doesn’t care about your bills, your emotions, or your need for instant gratification.
It operates on its own timeline, and your job is to align with that rhythm.
What Requires Patience:
- High-yield setups that align with structure
- Market structure formation completion
- Confirmed structure breakouts (not false breaks)
Think of patience as your trading superpower. While others chase every minor move, you’re positioned for the trades that matter the ones that align with structural significance and offer favorable risk-to-reward ratios.
TRADING BOOM AND CRASH WITH $10: MAKING SMALL ACCOUNTS WORK
The question isn’t whether you can start trading Boom and Crash with $10 Deriv allows it.
The real question is whether you can make it work sustainably. Here’s the reality check: while a $10 account is possible, it requires exceptional discipline and realistic expectations.
Small Account Strategies
Position Sizing: With a $10 account, you’re looking at micro-lots or even smaller positions. Your focus should be on percentage returns rather than absolute dollar amounts.
A 10% return on $10 is $1—not life-changing money, but the percentage is what matters for scalability.
Risk Management: Risk no more than 1-2% per trade. Yes, that means risking 10-20 cents per trade on a $10 account. It sounds insignificant, but it’s the foundation of sustainable trading.
Blow up a few $10 accounts learning this lesson, and you’ll appreciate its importance.
Compound Growth: Your $10 account isn’t meant to pay your bills—it’s your trading laboratory. Focus on consistent percentage gains, and let compound growth work its magic over time.
CHART PATTERNS AND TECHNICAL ANALYSIS
Boom and Crash indices exhibit the same chart patterns found in traditional markets, but with their own unique characteristics.
These patterns aren’t just pretty pictures they’re probabilistic roadmaps that guide your trading decisions.
Common Patterns to Watch
Continuation Patterns
- Flags and pennants often precede major spikes
- Triangular consolidations typically break in the direction of the prevailing trend
- Rectangular ranges provide clear support and resistance levels
Reversal Patterns
- Double tops and bottoms at significant structural levels
- Head and shoulders patterns that align with structure breaks
- Divergence patterns between price and momentum
TIME MANAGEMENT AND SESSION ANALYSIS
Best Times to Trade Boom and Crash

Forget about London sessions, New York opens, or Sydney closes Boom and Crash indices don’t follow traditional forex session patterns.
The best time to trade Boom and Crash is when technical conditions align, regardless of your local time zone.
Key Timing Factors:
- Structure breakouts (can occur at any time)
- Spike formations at significant levels
- Confluence of multiple technical factors
Timeframe Selection
H4 Timeframe: The Sweet Spot The H4 timeframe emerges as the goldilocks zone for Boom and Crash trading. It’s not too noisy like the 1-minute charts, nor too slow like the daily charts. H4 provides:
- High-yield setups with substantial profit potential
- Stronger support and resistance levels
- More accurate market structure formations
- Reduced noise and false signals
Why Avoid 1-Minute Strategies: One-minute strategies might seem appealing with their frequent signals, but they’re fraught with danger.
The noise-to-signal ratio is incredibly high, leading to overtrading and emotional decision-making. Focus on quality setups over quantity.
PRICE ACTION: THE UNIVERSAL LANGUAGE
Price action trading is the foundation of successful Boom and Crash trading. It’s the universal language that transcends indicators, oscillators, and complex systems.
When you can read raw price movements, you’re seeing the market’s true intentions.
Core Price Action Elements
Pin Bars These are the market’s way of showing rejection at key levels. A pin bar at a significant support or resistance level often signals a reversal or continuation, depending on the context.
Inside Bars These represent consolidation and indecision. When inside bars form at structural levels, they often precede significant moves.
Engulfing Patterns These show a clear shift in momentum and are particularly powerful when they occur at structure levels.
RISK MANAGEMENT: YOUR TRADING LIFELINE
All the market structure knowledge in the world won’t save you without proper risk management. It’s the difference between a trading account and a gambling account.
The 1% Rule
Never risk more than 1% of your account on a single trade. This isn’t just a suggestion—it’s a commandment.
With proper risk management, you can be wrong 10 times in a row and still have 90% of your account intact.
Position Sizing Calculator
| Account Size | 1% Risk | 2% Risk | Position Size (0.01 lots) |
| $100 | $1 | $2 | 0.01-0.02 |
| $500 | $5 | $10 | 0.05-0.10 |
| $1000 | $10 | $20 | 0.10-0.20 |
| $5000 | $50 | $100 | 0.50-1.00 |
IS BOOM AND CRASH PROFITABLE?
The million dollar question: Is Boom and Crash profitable? The answer is both yes and no, depending entirely on your approach.
These indices are pure technical instruments, unaffected by economic news or geopolitical events. This makes them both easier to analyze and harder to master.
Profitability Factors:
- Technical analysis skills
- Risk management discipline
- Emotional control
- Patience and persistence
- Continuous learning and adaptation
Common Pitfalls:
- Overtrading due to constant movement
- Ignoring risk management principles
- Chasing spikes without proper analysis
- Emotional trading decisions
Moving Averages and Indicators
While price action is king, certain indicators can enhance your analysis when used correctly. The key is not to rely on them blindly but to use them as confirmation tools.
Best Moving Averages for Boom and Crash:
- 21 EMA: Excellent for short-term trend identification
- 55 EMA: Perfect for medium-term trend analysis
Remember, these are tools to support your price action analysis, not replace it. The market doesn’t care about your moving average crossover if it conflicts with clear structural levels.
ADVANCED CONCEPTS
Context Trading on Boom and Crash Indices
Context trading on Boom and Crash indices involves understanding the current market environment and adapting your strategy accordingly. Are we in a trending market or a ranging market? Is volatility high or low? These contextual factors influence your trading approach.
Trending Markets
- Focus on breakout strategies
- Use pullbacks for entry opportunities
- Ride trends longer than usual
Ranging Markets
- Focus on reversal strategies at boundaries
- Use mean reversion techniques
- Take profits more aggressively
Understanding Ticks and Spikes
What are Ticks? In Boom indices, ticks represent bearish movements, while in Crash indices, ticks represent bullish movements. Understanding this inverse relationship is crucial for proper analysis.
How Boom and Crash Work: These indices are programmed to produce one significant price movement (boom or crash) every 300, 500, or 1000 ticks, depending on the specific index. This predictable volatility makes them attractive to technical traders.
Practical Application
Setting Up Your Charts
- Primary Analysis Chart: D1 timeframe for overall trend and key levels
- Secondary Analysis Chart: H4 timeframe for structure and entry signals
- Execution Chart: H1 or H4 for precise entry and exit timing
Trade Execution Checklist
Before entering any trade, ensure you can answer these questions:
- What’s the dominant trend on the daily chart?
- Where are the key support and resistance levels?
- Is there a clear break of structure?
- What’s my risk-to-reward ratio?
- Where will I place my stop loss and take profit?
TOOLS AND RESOURCES
Recommended Platforms
- Deriv: The primary broker for Boom and Crash indices
- TradingView: Excellent for chart analysis and pattern recognition
- MetaTrader 5: Advanced charting and automated trading capabilities
Educational Resources
- Price action trading courses
- Market structure analysis guides
- Risk management calculators
- Trading psychology resources
CONCLUSION: YOUR PATH TO MASTERY
The top secret on how to trade Boom and Crash isn’t really a secret at all it’s a methodical approach based on sound technical principles.
Market structure analysis, combined with proper risk management and unwavering patience, forms the foundation of profitable trading.
Remember, these indices reward technical precision and punish emotional decisions. They’re not get-rich-quick schemes but rather sophisticated instruments that require skill, discipline, and continuous learning to master.
Your journey to mastering Boom and Crash trading begins with understanding that consistency trumps complexity.
Focus on the fundamentals: market structure, price action, and risk management. Master these elements, and you’ll find that the “secrets” reveal themselves naturally through experience and practice.
The market will always be there tomorrow, but your trading capital might not be if you don’t respect its power.
Start small, learn continuously, and let compound growth work in your favour. The traders who succeed in Boom and Crash indices aren’t necessarily the smartest—they’re the most disciplined.
Are you ready to transform your approach to synthetic indices trading? The market is waiting, and armed with this knowledge, you’re better prepared than 90% of traders out there.
The question now is: will you be patient enough to wait for the right setups, disciplined enough to manage your risk, and persistent enough to see it through?
Ready to put these strategies into practice? Start with a demo account, apply these principles consistently, and watch as the seemingly chaotic movements of Boom and Crash indices begin to make perfect sense. Your trading journey begins with a single step—make sure it’s in the right direction.


Very good and interested ideas
Thanks so much, Nelson. We are glad you found the information useful!Feel free to drop in anytime.