Deriv synthetic indices have been available for years, and since their inception, traders have grown increasingly interested since synthetic indices avoid the risks associated with currency trading.
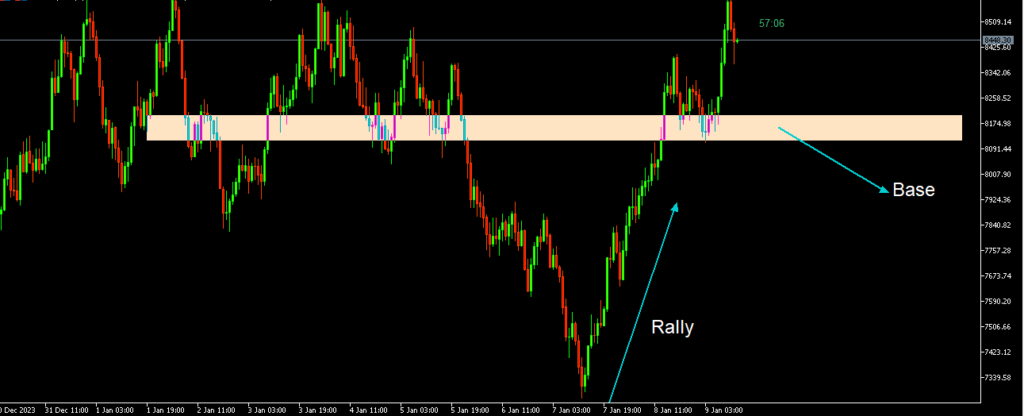
With the many Deriv synthetic indices available to traders, our goal in this article is to show you how to trade volatility 75 1s effortlessly using the basic rally base rally and drop base drop principles, while remaining focused on market structure and breakout formations.
Whether you are a beginner or a seasoned trader, you will find the information in the article helpful as it will help you with a broader perspective on the most important aspect of trading.

HOW TO TRADE VOLATILITY 75 1S FOR BEGINNERS
Before I talk about how to trade volatility 75 1s for beginners, I want to point out the misconception that many beginner traders have regarding trading, as an experienced trader, I can tell you that there is no perfect trading strategy, if you are on that search, you can stop now.
As a beginner what is most important is to understand market structure, market psychology, rally base rally and drop base drop, and market dominant trend. Etc.
– ForexBrainbox
As a beginner, if you pay attention to the above, you will save yourself years of going through circles looking for the perfect indicator or trading strategy.

Below you will find live image examples of how to trade volatility 751s taking into consideration market psychology and market structure.

HOW TO TRADE VOLATILITY 75 1S

As an experienced Deriv synthetic trader, this is how I trade volatility 75 1s:
- Identify the dominant trend
- Look out for rally base rally or drop base drop
- Use multiple time frame analysis
- Identify break of structure
DIFFERENCE BETWEEN VOLATILITY 75 AND VOLATILITY 75 (1S)
There are two major differences between volatility 75 and volatility 75 (1s).
The first one is that the volatility 75 index moves at a constant volatility of 75% with a tick every 2 seconds while volatility 75 (1s) moves at a constant volatility of 75% with a tick every 1 second.
The second one is that volatility 75 minimum lot size is 0.001 while volatility 75 (1s) minimum lot size is 0.05.
HOW TO TRADE V75 1S
V75 1s is the same as volatility 75 1s, to effectively trade v75 1s and see consistent profit; you have to pay attention to the dominant trend on higher time frames.
Looking at a higher time frame will help you see the market from a higher perspective.
After identifying the dominant trend, apply market top-down analysis to look for market entry in a lower time frame in the direction of the dominant trend.
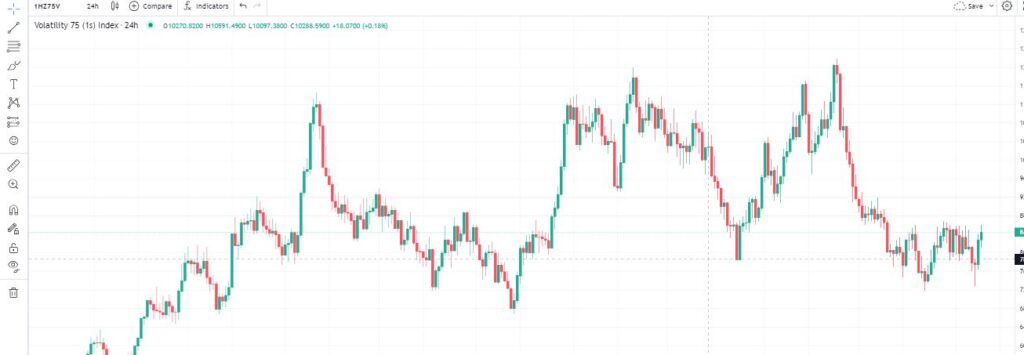
VOLATILITY 75 (1S) INDEX TRADINGVIEW

You can have access to volatility 75 (1s) trading view on Deriv with full access to all the synthetic pairs and all the default trading tools that you would find on Meta Trader 5.
SEE MORE: Deriv TradingView
CAN I TRADE VOLATILITY 75 INDEX ON A DAILY CHART?
Certainly, it is possible to use the daily chart for trading the Volatility 75 index; however, based on my experience, it may not be the most optimal approach, and here’s why.
When engaging in financial market trading, relying solely on a single time frame, particularly the daily chart, often leads to suboptimal trading decisions.
To make informed choices, it is essential to adeptly incorporate multiple time frames, allowing for a more comprehensive view of the market.
In essence, higher timeframes such as the daily chart serve the purpose of identifying the prevailing market trend, indicating the long-term direction.
On the other hand, lower timeframes become crucial for observing market formations and breakouts, facilitating more precise entries.
It’s important to note that trading on daily charts entails certain drawbacks, including the use of higher-stop losses, prolonged trade durations, fewer trading opportunities, and a necessity for larger capital.
Consequently, a balanced utilization of all time frames becomes imperative to gain a holistic perspective of the market, ensuring a more nuanced and strategic approach to trading.
By combining insights from different timeframes, traders can enhance their ability to make well-informed decisions and navigate the complexities of the Volatility 75 index with greater precision.
WHAT IS THE BEST INDICES TO TRADE ON DERIV?
There are no best indices to trade because if there were, everyone would focus on them to make money. Instead, you should grasp the basics of trading so that you can apply them to any derivative indices or financial trading instrument.


