Join me on this exciting journey as I show you how to use Fibonacci retracement with support and resistance on Forex and synthetic trading.
Above all forex trading terminologies, There is one that is consistent across all time frames.
Every trader, beginner or professional, can easily identify it; I’m referring to support and resistance.
What distinguishes you is your ability to combine this support and resistance with other trading tools and your trading strategy.
- HOW TO USE FIBONACCI RETRACEMENT WITH SUPPORT AND RESISTANCE
- IDENTIFY A RECENT MARKET IMPULSE (RECENT MARKET TREND) PREFERABLY ON A HIGHER TIMEFRAME
- WAIT FOR A MAJOR PULLBACK OR RETRACEMENT ON THE TRENDING TIMEFRAME
- DRAW YOUR FIBONACCI FROM THE MOST RECENT MARKET IMPULSE (LOW OR HIGH) TO THE MOST RECENT LOW OR HIGH.
- LOOK OUT THAT THE SUPPORT AND RESISTANCE MATCH WITH THE FIBONACCI RETRACEMENT ZONE
- HOW TO USE FIBONACCI RETRACEMENT IN FOREX
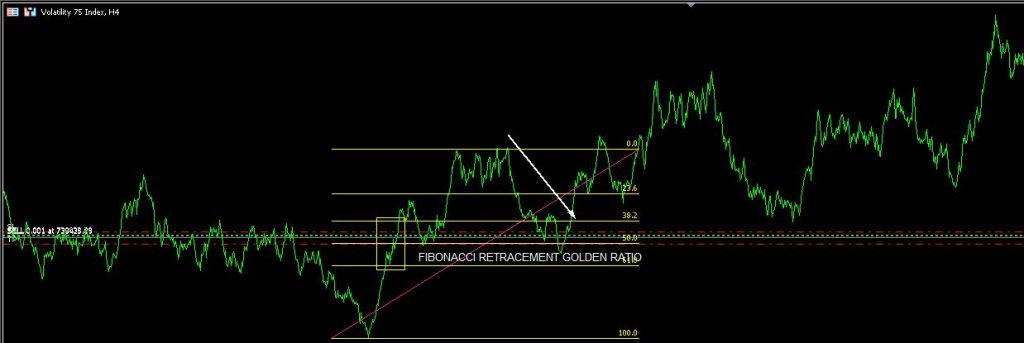
- FIBONACCI RETRACEMENT GOLDEN RATIO
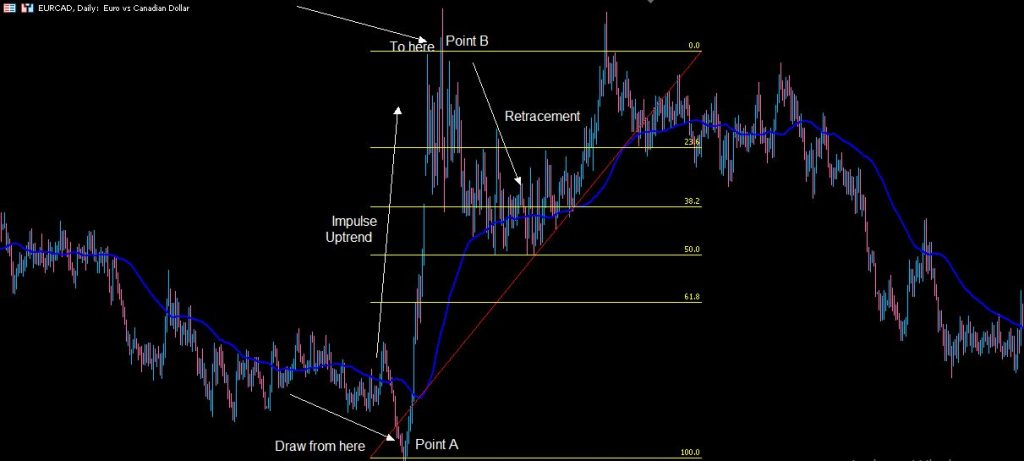
- HOW TO DRAW FIBONACCI RETRACEMENT IN UPTREND
- HOW TO USE FIBONACCI EXTENSION TO KNOW WHEN A TREND WILL END
- IS FIBONACCI RETRACEMENT SUPPORT AND RESISTANCE?
- HOW DO YOU USE FIBONACCI TO FIND SUPPORT AND RESISTANCE?
- WHAT IS THE BEST FIBONACCI RETRACEMENT LEVEL?

HOW TO USE FIBONACCI RETRACEMENT WITH SUPPORT AND RESISTANCE
To effectively use Fibonacci retracement with support and resistance you have to
- Find a recent market impulse (recent trend market) preferably on a higher timeframe
- Wait for a major pullback or retracement on the trending timeframe
- Draw your Fibonacci from the most recent market impulse (low or high) to the most recent low or high.
- Look out that previous support and resistance match with the recent Fibonacci retracement zone.
Below is an image that explains how Fibonacci, support, and resistance can be used together.
Note that there are three major reversal levels on a Fibonacci tool. These three levels are possible levels where a market retracement can rest before trend continuation.
The three major retracement levels are 38.2, 50, and 61.8.
READ ALSO: BEST TIME FOR FIBONACCI RETRACEMENT
READ ALSO: FIBONACCI SCALPING STRATEGY
IDENTIFY A RECENT MARKET IMPULSE (RECENT MARKET TREND) PREFERABLY ON A HIGHER TIMEFRAME
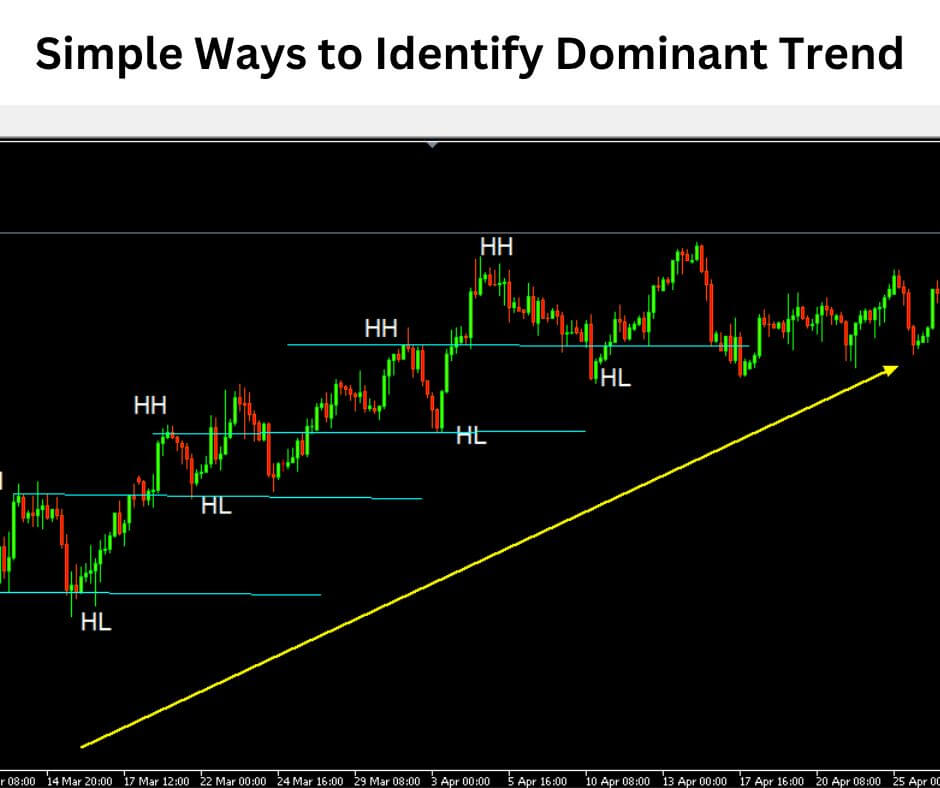
Finding a recent market impulse requires identifying a trend early enough so that you will be able to join in on the trend continuation after a retracement.
This recent market impulse can be bullish or bearish and is preferable on higher timeframes from H1 and above.
See the below image of the market impulse:

WAIT FOR A MAJOR PULLBACK OR RETRACEMENT ON THE TRENDING TIMEFRAME
Before a major pullback or retracement happens, there must have been a strong bullish or bearish move.
This retracement often settles on a previous low/high or support and resistance zone.

The level the market retraces to becomes the new support and resistance zone.
Below is an image showing a retracement market after the market impulse move:
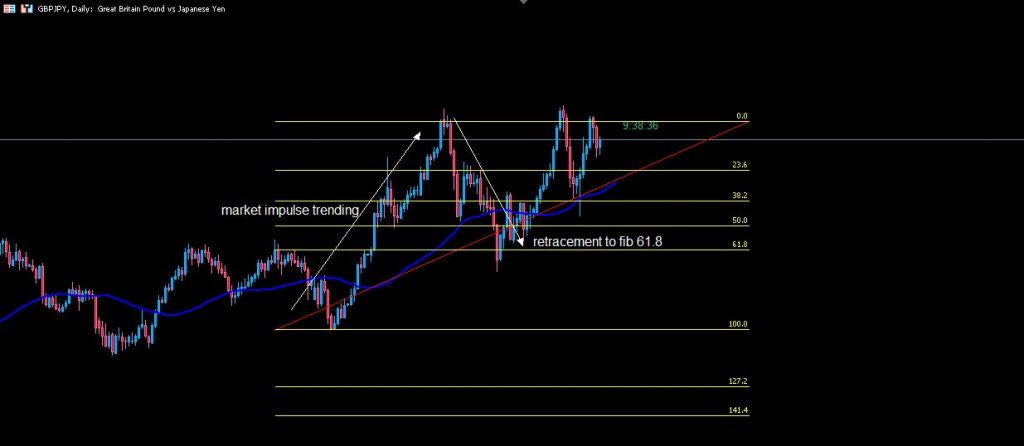
DRAW YOUR FIBONACCI FROM THE MOST RECENT MARKET IMPULSE (LOW OR HIGH) TO THE MOST RECENT LOW OR HIGH.
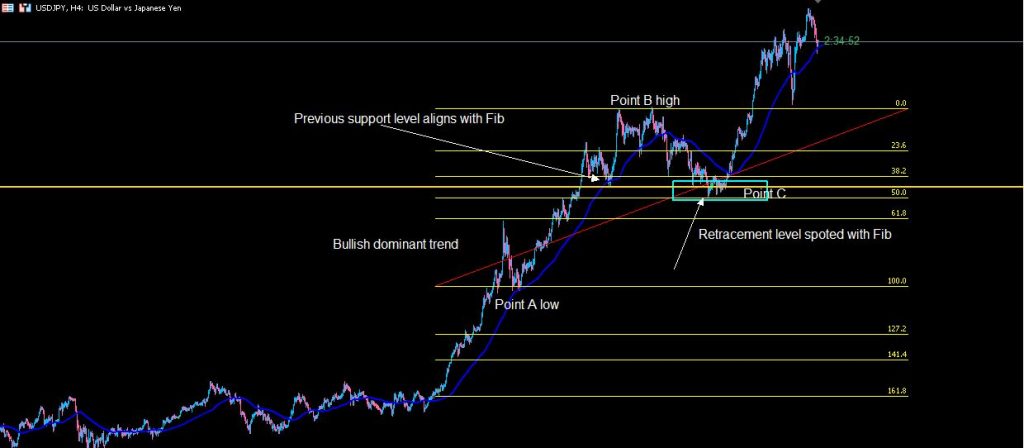
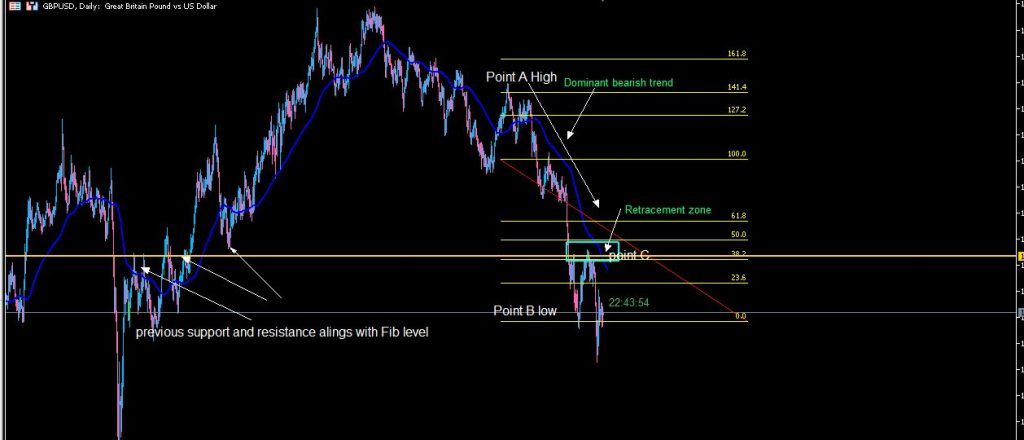
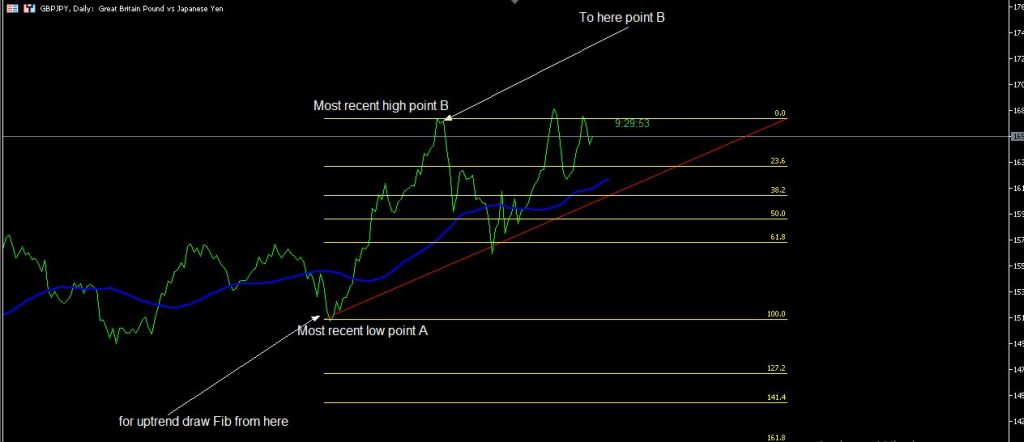
To draw your Fibonacci, there has to be a recent low and a recent high which can be named points A and B respectively then there will be a point C which will be the point where the market retraces before the dominant trend resumption.
This is explained properly by the use of the diagram below:
LOOK OUT THAT THE SUPPORT AND RESISTANCE MATCH WITH THE FIBONACCI RETRACEMENT ZONE
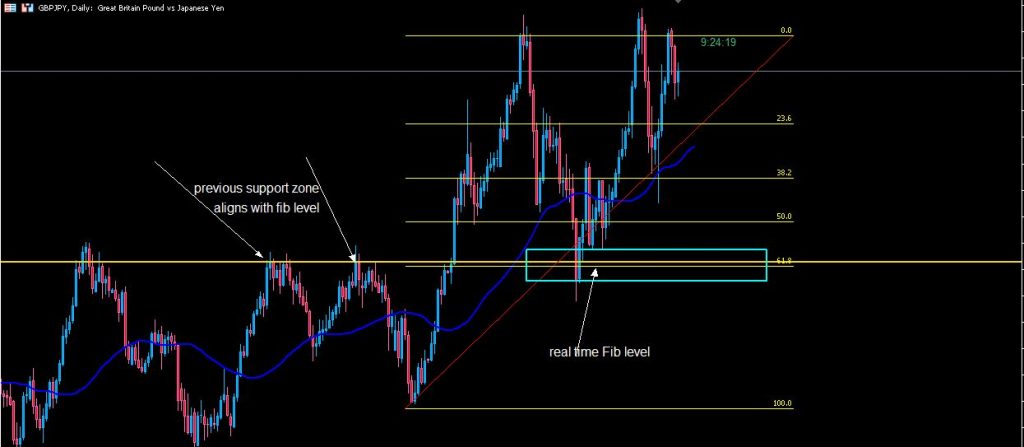
This is where the trick is, after properly drawing out your Fibonacci; you will see how the Fibonacci retracement levels match with the most recent support and resistance zone.
This alignment of Fibonacci with support and resistance makes it a strong zone to look out for possible market entry.
See the image below for an explanation:
HOW TO USE FIBONACCI RETRACEMENT IN FOREX
A trader who has mastered the use of the Fibonacci tool will always have a competitive advantage over regular traders who rely solely on indicators.
I didn’t realize how important and effective the Fibonacci tool could be until I started using it and became addicted to it because of its accuracy.
That being said, the Fibonacci tool is a must-have for any trader; as it is essential both in forex and synthetic trading.
The best way to use Fibonacci retracement in Forex or synthetic trading is to concentrate on the three Fibonacci levels for a market retracement after market impulse.
More information on this topic can be found at the top of this article.
FIBONACCI RETRACEMENT GOLDEN RATIO
Fibonacci Retracements are ratios that are used to identify potential reversal points. The Fibonacci sequence contains these ratios. The most common Fibonacci retracements are 61.8, 50, and 38.2 percent. This is known as the golden mean ratio.
The occurrence of this Fibonacci retracement golden ratio is consistent across all timeframes, especially higher timeframes. This golden ratio can only be applied to a market after a trend has been confirmed.
Traders who are aware of this Fibonacci golden ratio watch out for trending markets to retrace to these zones and take advantage of it.
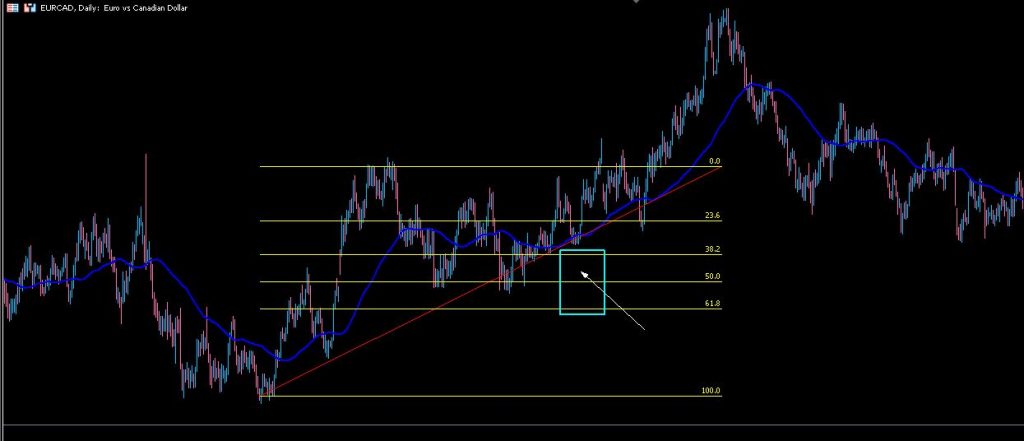
This will not be complete without showing you a detailed image explanation of a Fibonacci retracement golden ratio.
See images below of a Fibonacci retracement golden ratio of Forex and Synthetic trading:
HOW TO DRAW FIBONACCI RETRACEMENT IN UPTREND
To begin with, to draw a Fibonacci retracement in an uptrend, a trader must first establish that the dominant trend is bullish. If your analysis on defining the dominant trend is wrong then your Fibonacci drawn will be wrong.
So let us imagine you have determined that the dominant trend is bullish; this will be the following steps to take.
- Draw your Fibonacci from the recent low to the recent high (points A to B)
- Wait for the market retracement to one of the Fibonacci retracement levels
- Look out that the retracement levels align with previous/recent support zones as this will validate your entry.
Below is an image example of how to draw Fibonacci retracement in an uptrend:
HOW TO USE FIBONACCI EXTENSION TO KNOW WHEN A TREND WILL END
One common challenge traders get to deal with is not knowing when a trend will end; thereby leaving too early or too late.
The question now is whether there is a way to determine when a trend will end. There are several ways to tell that a trend is coming to an end. One method is to use major support and resistance zones on higher timeframes.
However, in this article, our focus will be on how to use a Fibonacci extension to know when a trend will end.
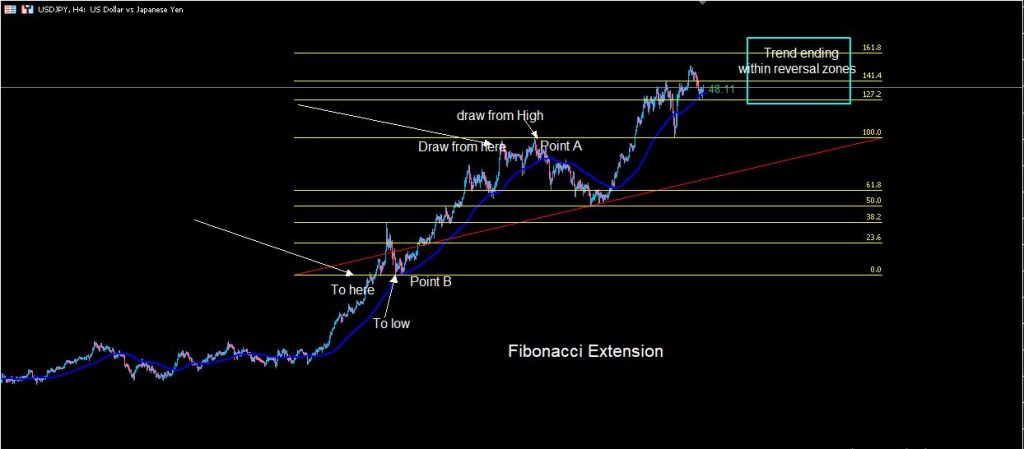
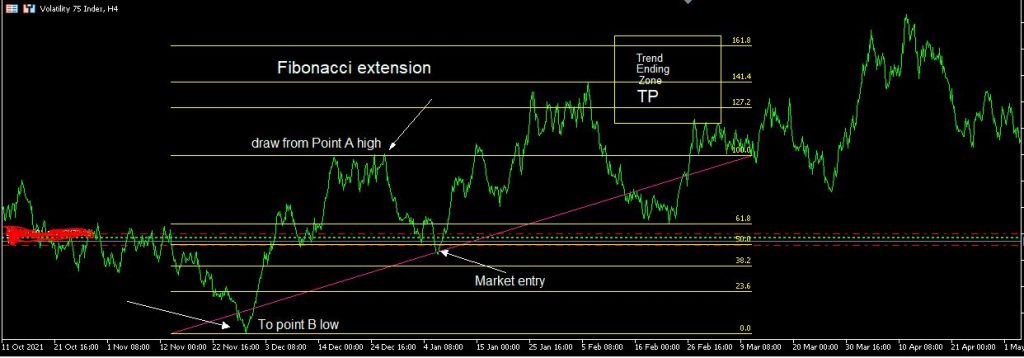
Before I show you how to use the Fibonacci extension tool to know when a trend will end, let me list the three most used Fibonacci extension levels used by traders to know when a trend will end.
The three extension levels are
- 127.2
- 141.4
- 161.8
The Fibonacci extension levels mentioned above are levels where the market may eventually return after a long market trend.
To draw your Fibonacci extension you must first:
- establish a dominant market trend on the higher timeframe (market impulse)
- Draw the Fibonacci from a recent high to a recent low
Below are images views of the Fibonacci extension to know when a trend will end:

IS FIBONACCI RETRACEMENT SUPPORT AND RESISTANCE?
No, Fibonacci retracement is not support and resistant but when used together gives a strong market confirmation as the Fibonacci retracement zone often aligns with previous support and resistance zones.
HOW DO YOU USE FIBONACCI TO FIND SUPPORT AND RESISTANCE?
Draw your Fibonacci from a recent low (point A) to a recent high (point B) on an uptrend or from a recent high (point A) to a recent low (point B) on a downtrend.
You will look out for the Fibonacci retracement levels aligning with support and resistance levels.
WHAT IS THE BEST FIBONACCI RETRACEMENT LEVEL?
There are no best Fibonacci retracement levels; however, some Fib levels have stronger market moves than others.
38.2 Fibonacci retracement level is stronger than the 50 levels, while the 50 Fib level is stronger than 61.8.


